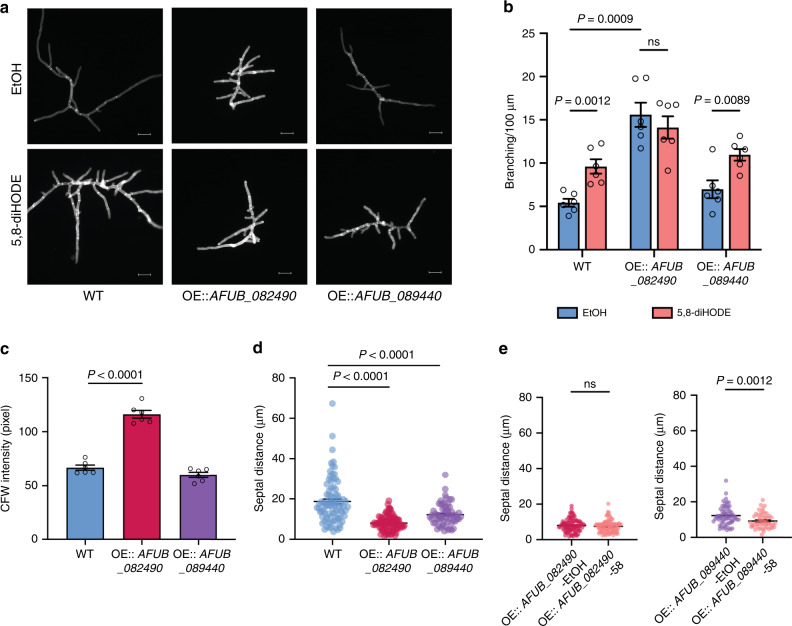
Fig. 7. Overexpression of AFUB_082490 and AFUB_089440 reveals major involvement in 5,8-diHODE-induced branching.
a Representative DAPI images of A1160 pyrG+ WT, OE::AFUB_082490 and OE::AFUB_089440 grown in GMM containing 0.1% EtOH or 5 µg/mL of 5,8-diHODE on coverslips in 24-well plates. Sixteen-hour-old hyphae were stained with calcofluor white (CFW), washed in ddH2O, and mounted to slides for fluorescent microscopy. Six DAPI images were acquired from three wells for each condition in each strain (n = 6). Images are representative of six microscopic images acquired for each condition. Scale bars represent 20 µm. b Branching quantification of OE::AFUB_082490 and OE::AFUB_089440 and the A1160 pyrG+ WT control (n = 6) in the experiment conducted in (a). Six hyphae from the six DAPI images were analyzed for branching for each condition in each strain. c Quantification of CFW signals (n = 6) of hyphae grown in GMM + 0.1% EtOH from images acquired in (a). Six hyphae in the six DAPI images were analyzed, where hyphae in each DAPI image were selected through the thresholding function in FIJI, and the mean fluorescence intensity of each threshold area was measured. d Quantification of distances between adjacent septa in hyphae grown in GMM + 0.1% EtOH from experiments conducted and imaged acquired in (a). Sample sizes representing the number of septal distances counted for each strain are: n = 85 for WT, n = 90 for OE::AFUB_082490, and n = 61 for OE::AFUB_089440. e Quantification of septal distances in OE::AFUB_082490 and OE::AFUB_089440 hyphae grown in GMM + 0.1% EtOH (OE-EtOH) and GMM + 5 µg/mL 5,8-diHODE (OE-58) in the same experiment described in (a). Sample sizes representing the number of septal distances counted for each strain are: n = 90 for OE::AFUB_082490-EtOH, n = 92 for OE::AFUB_082490-58, n = 61 for OE::AFUB_089440-EtOH, and n = 53 for OE::AFUB_089440-58. A1160 pyrG+ WT was used as control for all experiments. Multiple two-sided t tests were used to compare between treatments in each strain in (b) and Brown–Forsythe and Welch ANOVA tests followed by Dunnett’s T3 multiple comparison test were used to compare across strains within each treatment group in (b–d). Welch two-sided t tests were used to compare between treatments within each strain in (e). All values represent mean ± SEM. ns not significant (P > 0.05).

