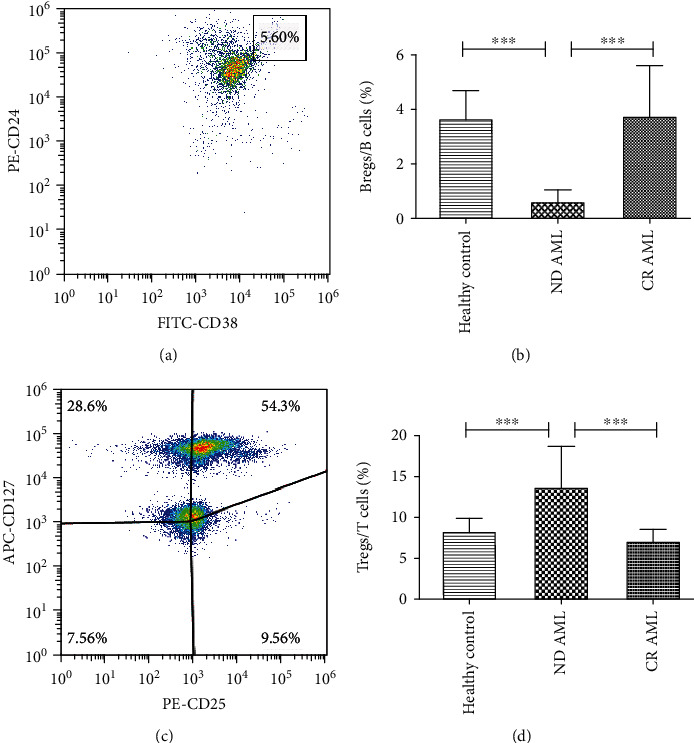
Figure 1.

Frequencies of peripheral Bregs and Tregs were detected in normal controls, ND AML patients, and AML patients in CR. (a) Representative flow cytometry analysis of peripheral CD19+CD24hiCD38hi Breg populations. (b) Frequencies of Bregs among CD19+ B cells in different groups. (c) Representative dot plot of peripheral CD4+CD25+CD127- Treg populations. (d) Frequencies of Tregs in CD4+ T cells in different groups. ∗∗∗P < 0.001. n = 15, 40, and 25, respectively.
