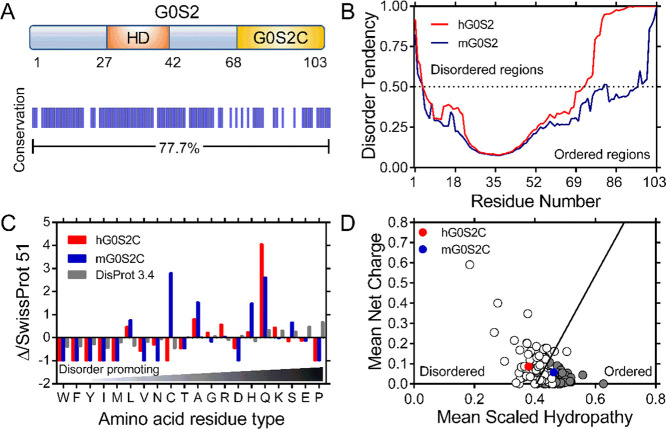
Figure 1.
In silico analysis of human and mouse G0S2. (A) Schematic representation of G0S2; the HD is shown in orange and the C-terminal region (G0S2C) in yellow. A graphical representation showing protein identity between human and mouse G0S2 is shown below. (B) Disorder prediction of human (red) and mouse (blue) G0S2 calculated by the GeneSilico MetaDisorder server with the panel showing the MetaDisorder analysis; values above 0.5 indicate a high disorder probability. (C) Amino acid distribution of human (red) and mouse (blue) G0S2C relative to the SWISS-PROT database; data are shown combined with the amino acid distribution found in IDPs (gray); composition enrichment (>0) or depletion (<0) is shown, generated with Composition Profiler. (D) Charge-hydropathy plot. The absolute, mean net charge versus mean hydropathy values for a set of disordered (open circles) and ordered (gray circles) proteins were plotted together with human and mouse G0S2C, red and blue circles, respectively.

