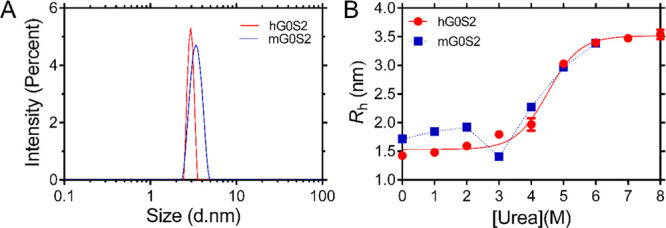
Figure 3.

Hydrodynamic radii of human and mouse G0S2 in native and unfolded state. (A) Sample size distributions of human (red) and mouse (blue) G0S2 obtained by DLS under native conditions. (B) Urea denaturation curve of human (red) and mouse (blue) G0S2 followed by DLS. The continuous line is the best fit using a multistate equilibrium display model.
