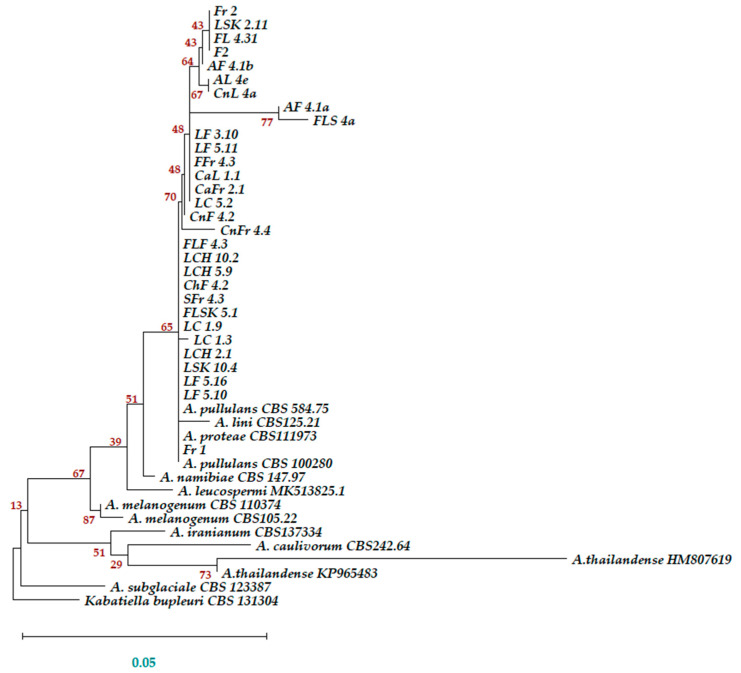
Figure 3.
The ITS sequences of the 30 A. pullulans isolates cluster with published A. pullulans, A. proteae, and A. lini ITS sequences. The evolutionary history was inferred by using the Maximum Likelihood method and Tamura–Nei model [35]. The tree with the highest log likelihood (−1641.85) is shown. The percentages of trees in which the associated taxa clustered together are shown next to the branches. The initial tree for the heuristic search was obtained automatically by applying the Maximum Parsimony method. A discrete Gamma distribution was used to model evolutionary-rate differences among sites (5 categories (+G, parameter = 0.2691)). The rate variation model allowed for some sites to be evolutionarily invariable ([+I], 0.00% sites). The tree is drawn to scale, with branch lengths representing the numbers of substitutions per site. This analysis involved 44 nucleotide sequences. There were a total of 675 positions in the final dataset. Evolutionary analyses were conducted in MEGA X [36].

