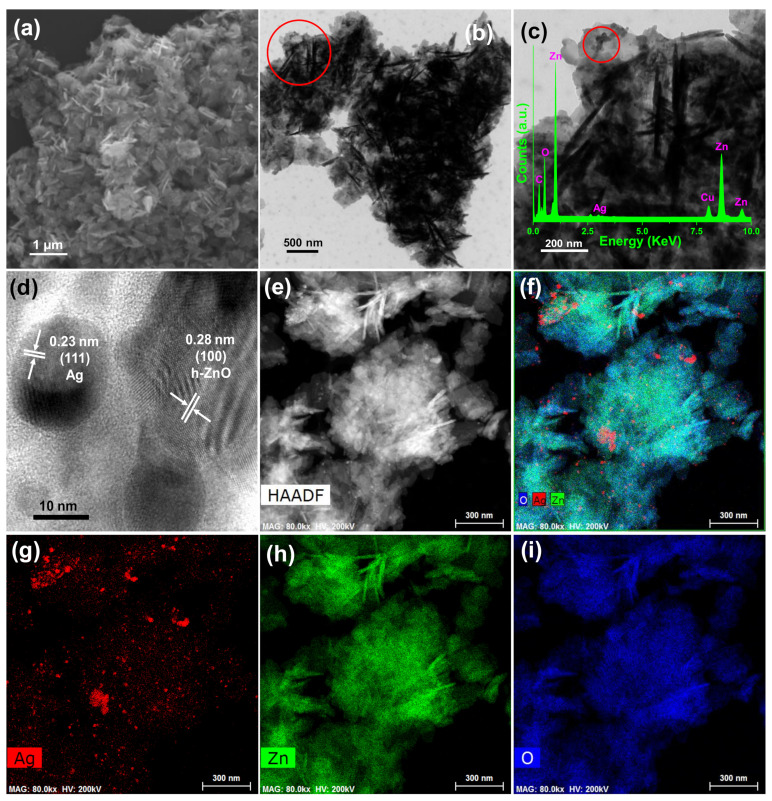
Figure 2.
(a) FESEM image of as-prepared ZO sample. (b,c) Transmission electron microscopy (TEM) images of AZO sample. (c) Enlarged TEM image of AZO sample from the marked portion of (b) with (c inset) TEM-energy-dispersive X-ray spectrum, (d) high-resolution TEM image of the AZO sample from the marked portion of (c), High-angle annular dark-field (HAADF) image (e), and elemental mappings of (f) composite, (g) Ag, (h) Zn, and (i) O.

