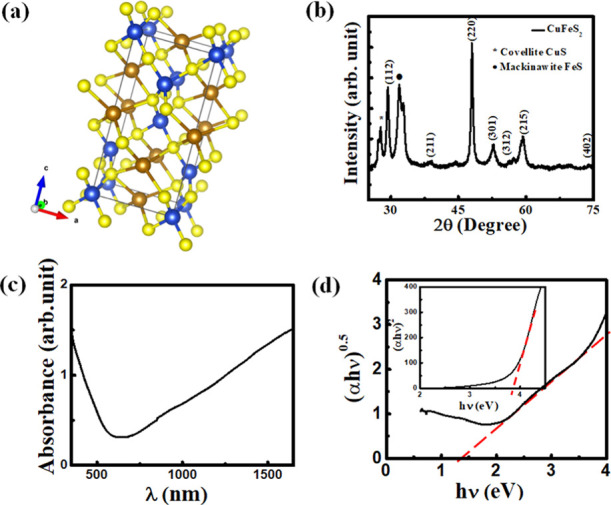
Figure 1.

(a) Crystal structure of CuFeS2. Blue, brown, and yellow colors represent Cu, Fe, and S atoms, respectively. (b) X-ray diffraction (XRD) pattern of a CuFeS2 nanocrystal, (c) solution-phase absorption spectrum of a CuFeS2 nanocrystal, and (d) Tauc’s plot that has been used to determine the indirect band gap. Inset: Tauc’s plot that has been used to determine the direct band gap.
