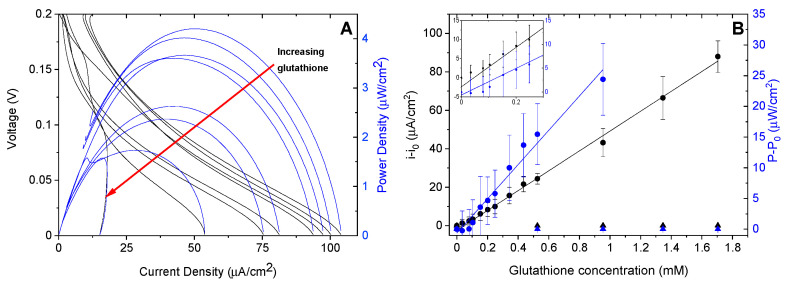
Figure 5.
(A) Representative linear polarization (black lines) and power curves (blue lines) for the complete GOx/BOx self-powered sensor with increasing amounts of glutathione. (B) Background subtracted current (black circles) and power (blue circles) of GOx/BOx biofuel cell with increasing glutathione concentration. Data for control fuel cells with BSA cathodes is also included (triangles). The inset shows a closer view of the data for lower glutathione concentrations.

