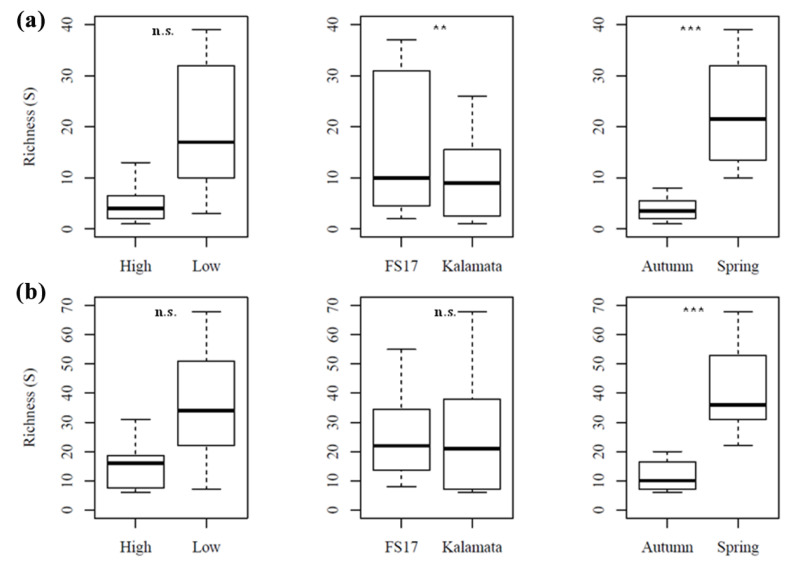
Figure 8.
Richness of (a) bacterial and (b) fungal communities occurring in the xylem of olive trees in relation to Xylella abundance (high vs. low), host cultivar (FS17 vs. Kalamata), and season (Spring vs. Autumn). Boxplots depict medians (central horizontal lines), the interquartile ranges (boxes), and 95% confidence intervals (whiskers). Statistical differences between pairs of values are showed (n.s., not significant; ** p < 0.01; *** p < 0.001).

