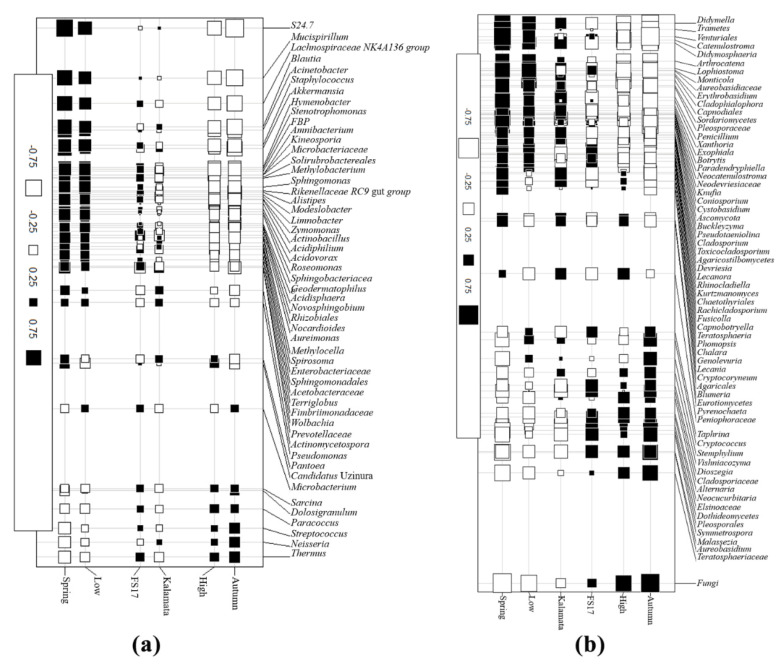
Figure 11.
Co-inertia factorial map showing positive (■) and negative (□) relationships between (a) bacterial and (b) fungal genera from olives with different Xylella abundance (high vs. low), from different cultivar (FS17 vs. Kalamata), and diverse seasons (Spring vs. Autumn). Square size is proportional to correlation intensity. The Fungi co-inertia factorial map shows only the genera with correlations higher than 0.25 (both positive and negative).

