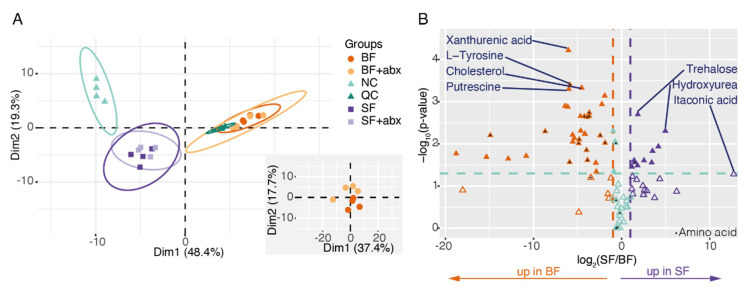
Figure 2.
The midgut metabolome is mainly affected by blood versus sugar diet. (A) Principal component analysis (PCA) biplots of the metabolomic analysis. Groups are colored by treatment and negative control (NC) and Quality Control (QC) are present. The bottom-right panel represents a PCA focusing on blood-fed samples. (B) Volcano plot of the metabolites in sugar-fed versus blood-fed samples. The x axis represents the log2 of the ratio of each metabolite between the two conditions. Orange and purple metabolites are >2-fold enriched in blood-fed and sugar-fed mosquito midguts (|log2(ratio)| > 1), respectively. The y axis represents the negative log10 applied to p-values. Metabolites located above the green line are significantly affected (p < 0.05; two-sided paired t-test; filled triangles) and metabolites below the green line are not (p > 0.05; two-sided paired t-test; open triangles). Black triangles highlight amino acids.

