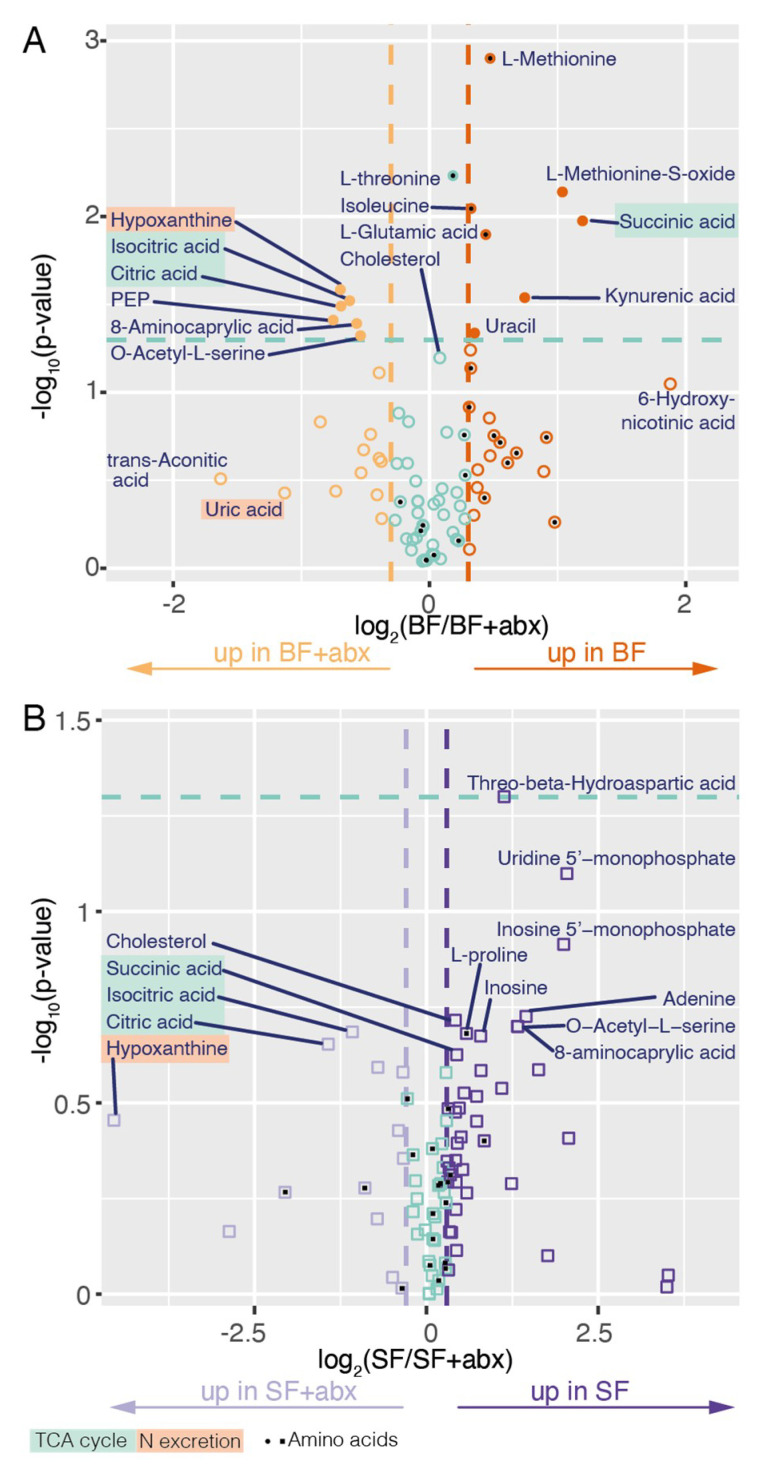
Figure 3.
Volcano plot of the metabolites in conventional (BF) versus antibiotic-treated (BF + ABX) blood-fed midguts (A) and in conventional (SF) versus antibiotic-treated (SF + ABX) sugar-fed midguts (B). The x axis represents the log2 of the ratio of each metabolite between the two conditions. Dark and light staining represent metabolites which are increased >35% in conventional and antibiotic-treated samples, respectively (|log2(ratio)| > 0.3). The y axis represents the negative log10 applied to p-values. Metabolites located above the green line are significantly affected (p < 0.05; two-sided paired t-test; filled symbols) and metabolites below the green line are not (p > 0.05; two-sided paired t-test; empty symbols). Black squares or circles highlight amino acids.

