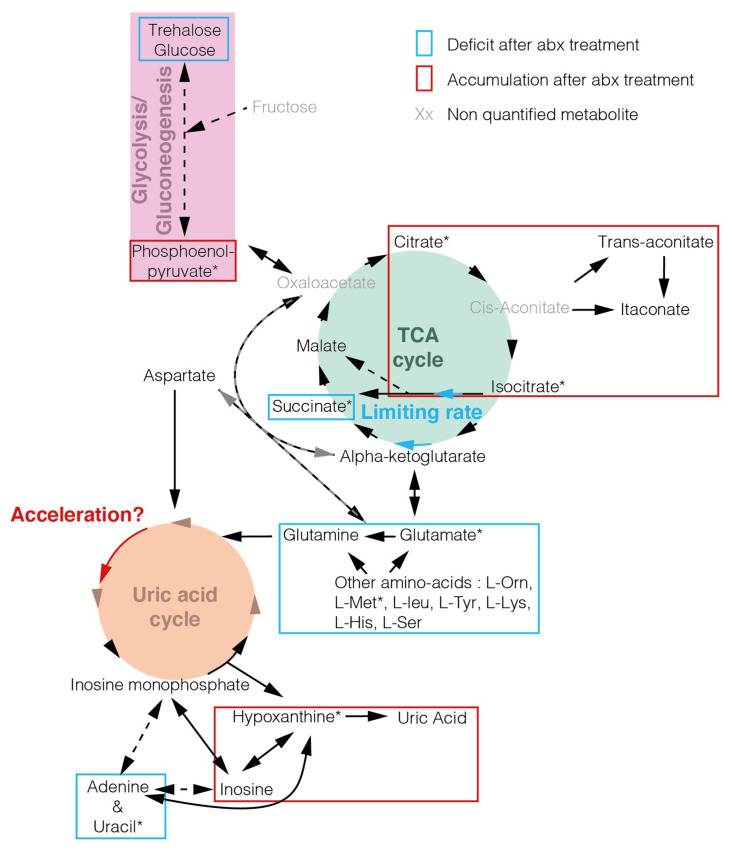
Figure 4.
Model—tricarboxylic acid (TCA) cycle and nitrogen metabolism are affected by antibiotic treatment. Metabolites detected in the analysis are shown in black and non-detected metabolites are shown in grey. * highlight significant metabolites between conventional blood-fed mosquitoes and antibiotic-treated ones (two-sided paired t-test). Deficits induced by the antibiotic treatment are cycled in blue and accumulations in red. Blue and red arrows indicate potential acceleration and limiting rate, respectively, that are suggested by accumulation or deficit of certain compounds in the pathways. Our data do not allow to determine whether the limiting rate in isocitrate to succinate conversion is linked to a deceleration at this step or to an increase in glycolysis.

