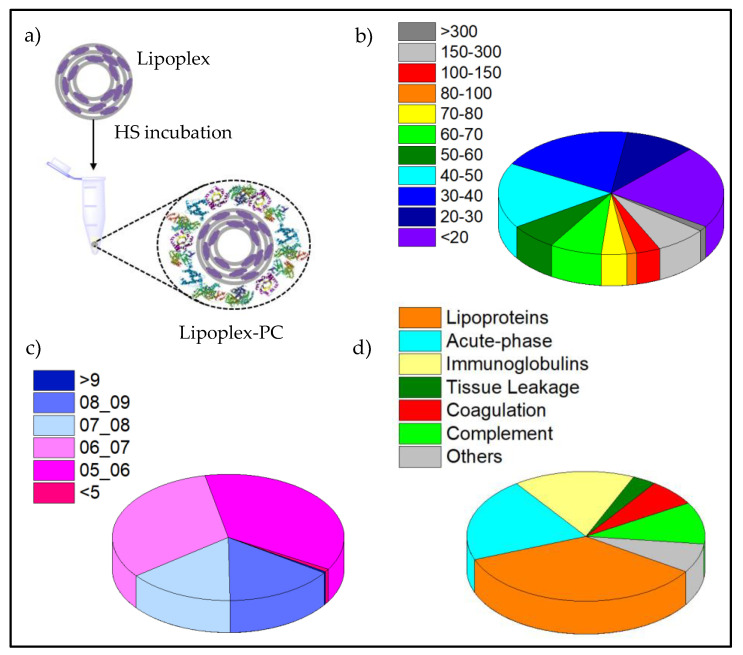
Figure 6.
(a) Scheme depicting protein corona formation (PC). Percentage of the proteins found within the protein corona (PC) of C3(C16His)2/MOG-siRNA lipoplexes at α = 0.2 and ρeff = 10, classified by their molecular weight, MW in kDa (pie chart b), by their isoelectrical point, pI (pie chart c) and by their physiological function (pie chart d).

