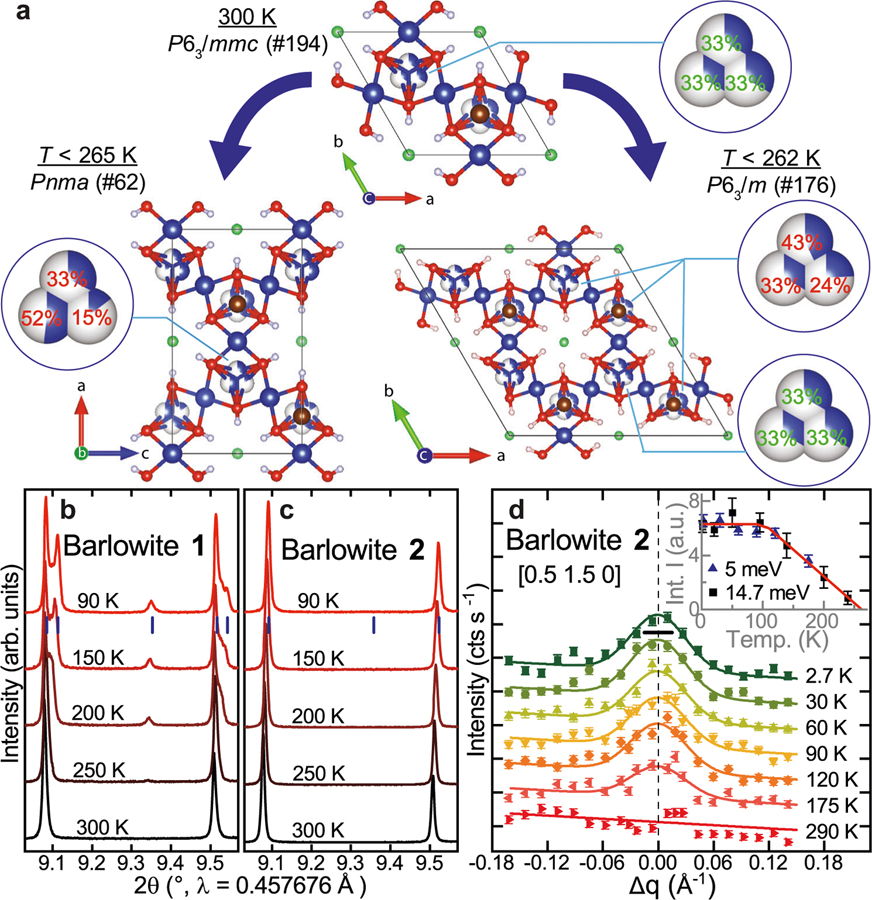
Fig. 1. Structures of barlowite 1 and 2.
a Schematic showing the two phase transitions of barlowite 1 and 2. The interlayer occupancy values are taken from SCXRD (Supplementary Table 3). b PXRD patterns from T=90K to 300K showing a Pnma superlattice peak and orthorhombic splitting in barlowite 1. c PXRD patterns from T=90K to 300K showing no visible P63/m superlattice peak nor orthorhombic splitting in barlowite 2. Bragg reflections of Pnma and P63/m, respectively, at T=90K are indicated by blue tick marks. d Elastic neutron scattering on single crystalline barlowite 2 with Ei=5meV showing the temperature dependence of the P63/m superlattice peak [0.5 1.5 0]. The notation of the high-temperature space group P63/mmc is used to index peaks. Inset: temperature dependence of the integrated intensity measured along the longitudinal and transverse directions of the wavevector Q in the scattering plane with Ei=5 and Ei=14.7meV, respectively, indicating that the structural transition occurs at T=262(8)K. Uncertainties are statistical in origin and represent one standard deviation.

