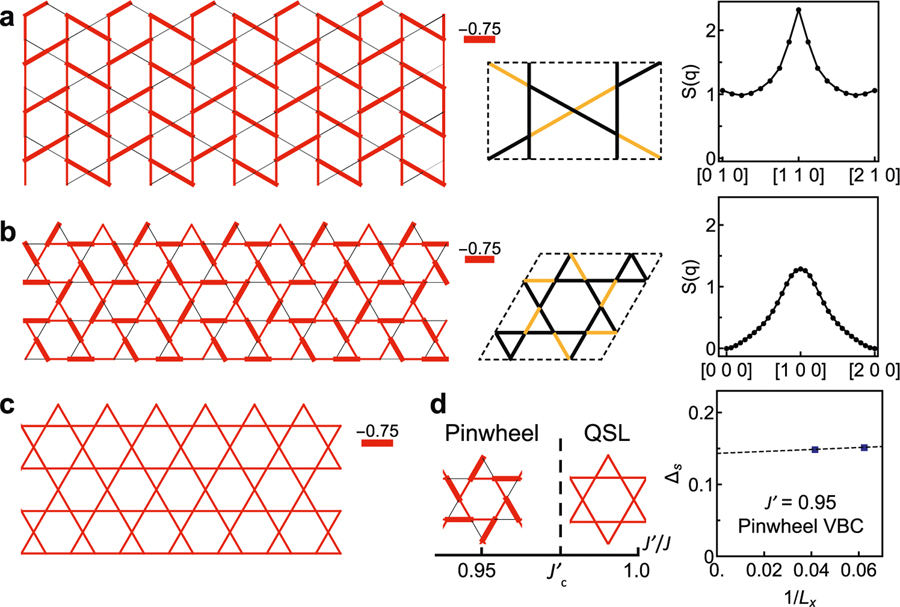
Fig. 3. Numerical simulations predicting three rival ground states.
a Illustration of a simplified J – J′ Heisenberg model for barlowite 1. The six-site unit cell is in the middle panel, and the bond pattern for J′ – 0.8J is shown in the left panel on a cylinder consisting of 16 × 4 unit cells (192 sites), where the bond thickness denotes the absolute value of〈Si · Sj〉. The corresponding spin structure factor S(q) in the right panel has a sharp peak at momentum [1 1 0]. b Illustration of a simplified J – J′ Heisenberg model for barlowite 2. The 12-site unit cell is in the middle panel, and the bond pattern for J′ = 0.95J is given in the left panel. The cylinder consists of 24 × 4 unit cells (288 sites). The spin structure factor S(q) in the right panel has a broad peak at momentum [1 0 0]. Here, the yellow lines denote bonds with interaction J′, while the black lines are bonds with interaction J. c The isotropic Heisenberg model with J – J′ and the corresponding uniform bond pattern in the QSL phase. The cylinder consists of 16 × 4 unit cells. d Schematic phase diagram of the J – J′ Heisenberg model as a function of J′ / J, where the dashed line J′c = 0.998(1) denotes the phase boundary between the pinwheel VBC and QSL phases. The spin gap Δs of the J′ = 0.95J point in the pinwheel VBC phase is plotted in the right panel, as a function of the inverse diameter of the cylinder. Error bars represent the confidence interval in the fitting procedure corresponding to ±σ (σ is the standard deviation).

