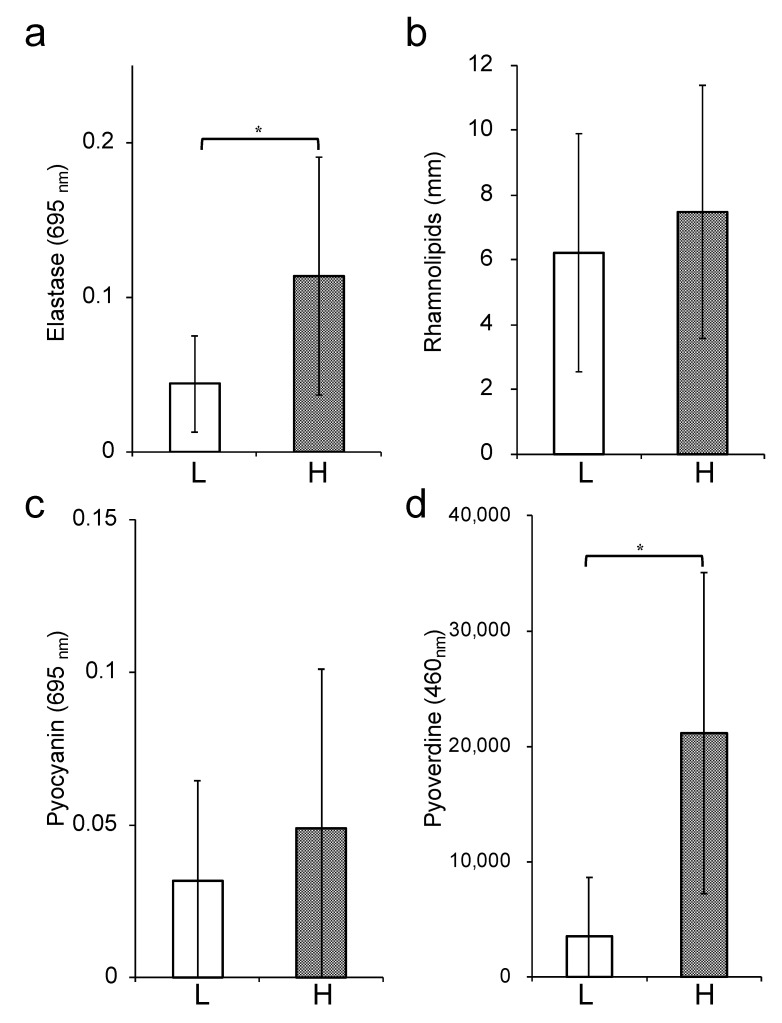
Figure 4.
Bacterial virulent factors production in the low- and high-tolerance groups. Elastase production (a), rhamnolipid production (b), pyocyanin production (c), and pyoverdine production (d) are shown. The white bars represent the low-tolerance group (n = 6), and the black bars represent the high-tolerance group (n = 9). Each experiment was performed in triplicate. The data are presented as the mean ± SD for three experiments (* p < 0.05 compared to the low-tolerance group).

