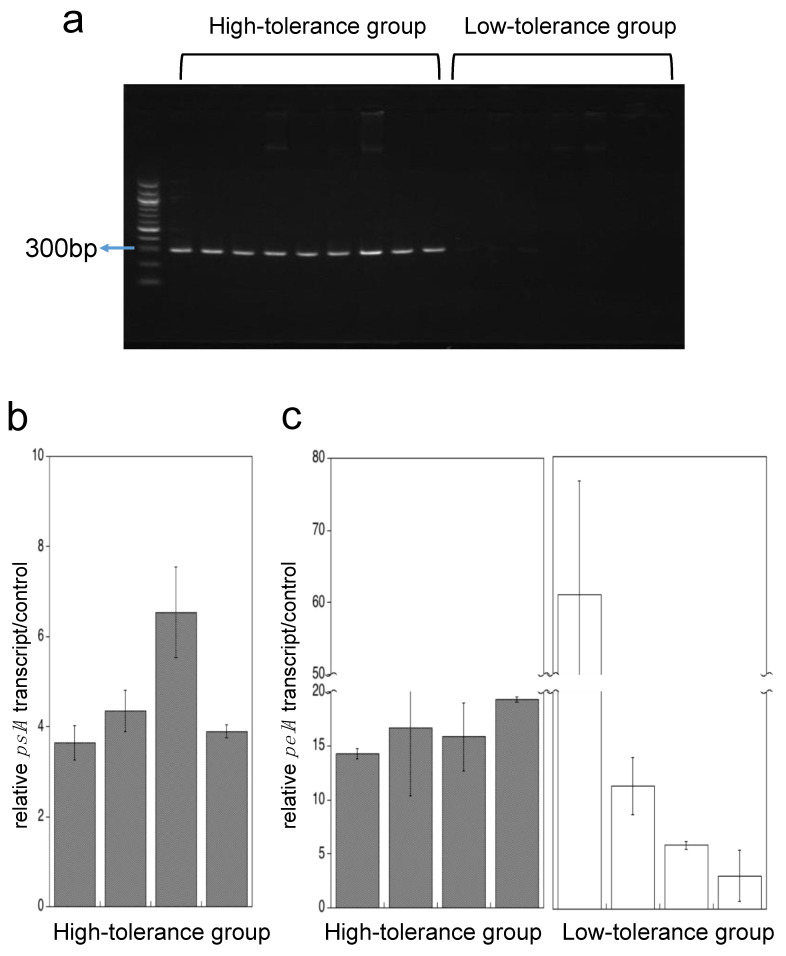
Figure 6.
pslA gene detection and transcription of pslA and pelA genes in adherent cells. Agarose gel electrophoresis of pslA amplicon (309bp) (a). PCR products were detected using 1.7% agarose gel stained with GelRed™. pslA gene expression of adherent cells in the high-tolerance group (b), and pelA gene expression of adherent cells in the high- and low-tolerance group (c) are shown. The black bars represent the high-tolerance group (n = 4), and the white bars represent the low-tolerance group (n = 4). Each experiment was performed in triplicate. The data are presented as the mean ± SD for three experiments.

