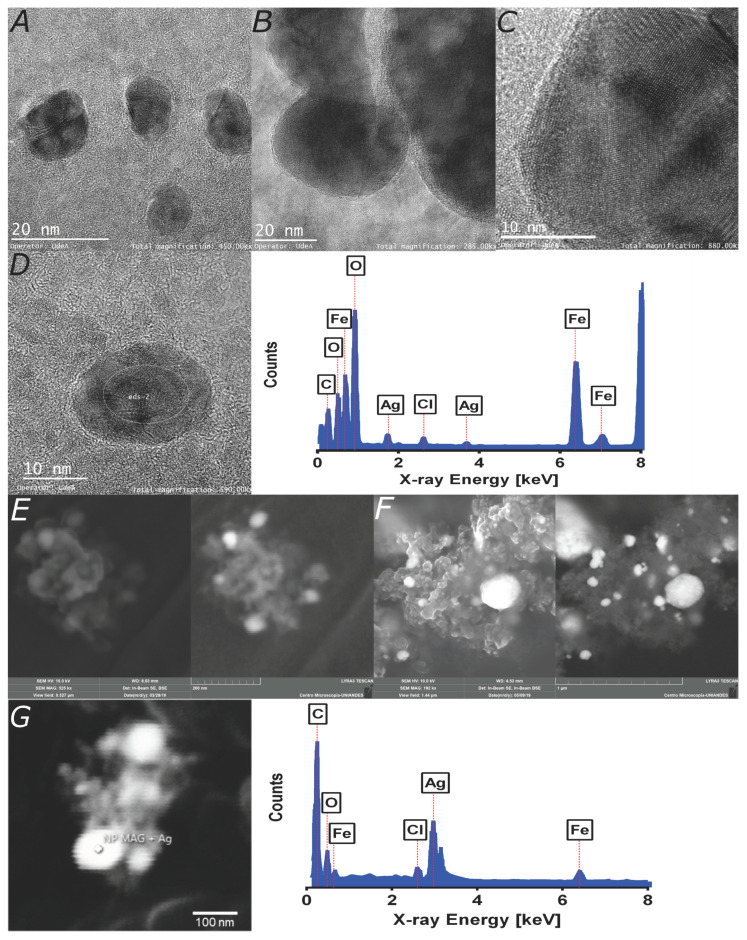
Figure 2.
Microscopy imaging and elemental characterization of TEM images. (A) Magnetite/silver nanoparticles are exhibiting an average diameter of 11.7 nm. (B) Magnetite clusters covered with a thin silver layer. (C) Patchy magnetite/silver nanoparticles as confirmed by the interplanar distances of the corresponding crystalline structures. (D) Elemental composition of the marked region, which confirms the presence of iron, silver, and chlorine. SEM images: (E) A core magnetite nanoparticles cluster synthesized by co-precipitation (scale bar corresponds to 200 nm). (F) Patchy magnetite/silver nanoparticles show a definite change in morphology. White spots are most likely related to the silver coverage (scale bar corresponds to 1 μm). (G) The marked region’s elemental composition verifies the presence of oxygen, iron, and silver, which are all related to the patchy bimetallic nanoparticles and chlorine remaining from the purification process. The carbon content is due to the graphite adhesive tape (scale bar corresponds to 100 nm).

