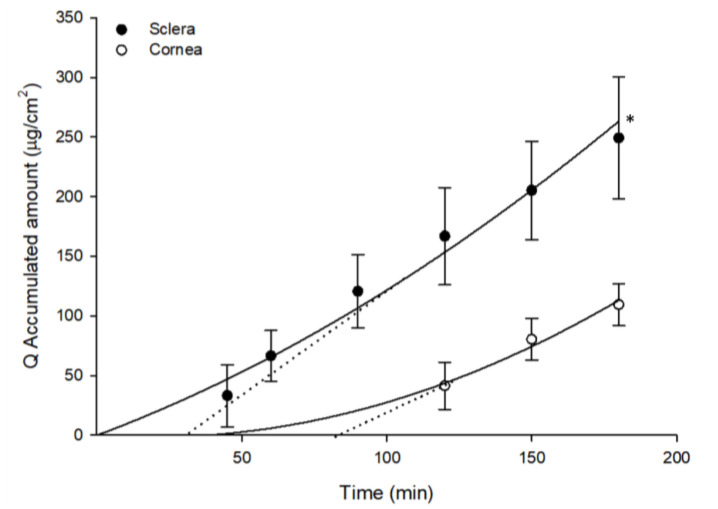
Figure 4.
Accumulated amounts of GSH in the receptor compartment (Q, μg/cm2) as a function of time, obtained from samples employed in ex-vivo trans-corneal and trans-scleral diffusion studies with the formulated insert. The dotted line represents the estimated lag time (t0) calculated by intersecting with the x-axis of the linear regression. (Mean ± SD; n ≥ 3) * p < 0.05.

