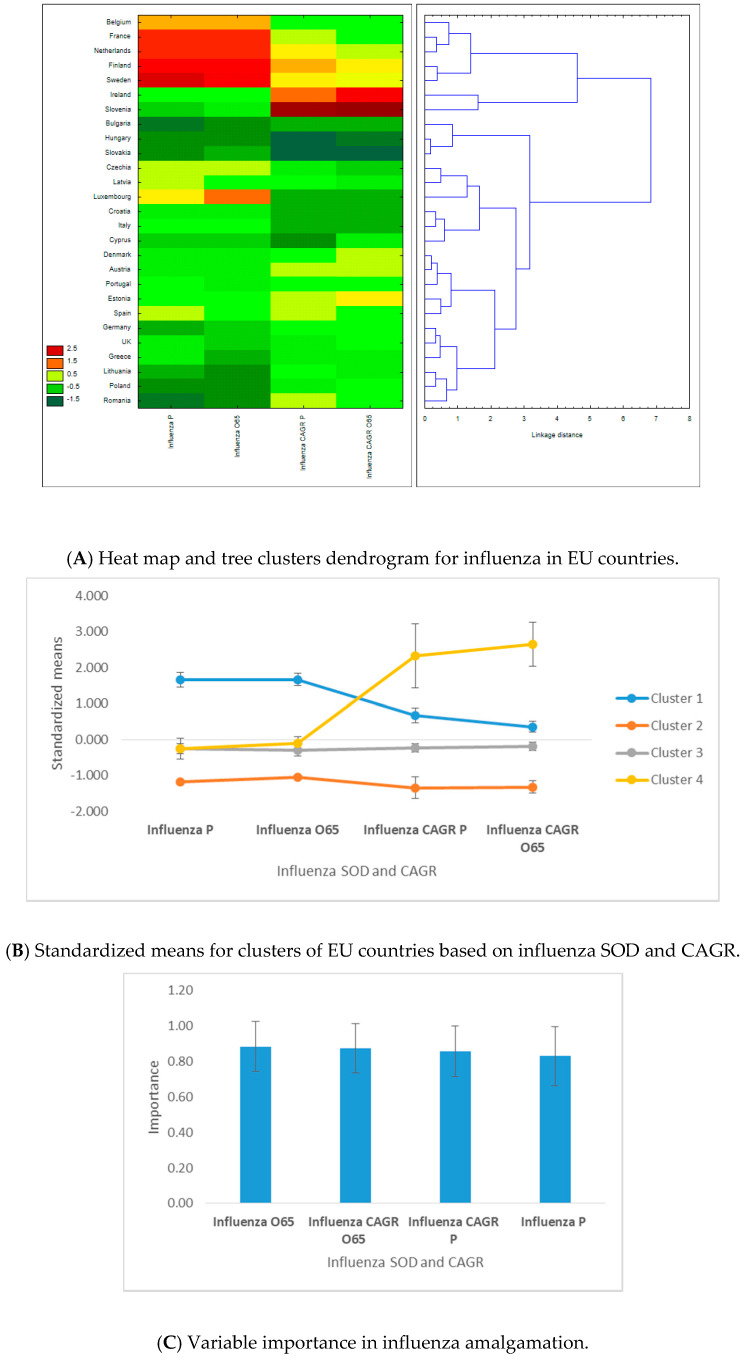
Figure 4.
Results of C&RT tree clustering of influenza for 28 European Union countries: heat maps, cluster attributes, and variable importance. (1) Tree clustering results are based on Euclidian distances and the Ward’s amalgamation method applied on shares of death (SOD) and compound annual growth rates (CAGR) for 27 EU countries (Malta was excluded due to lack of data availability) on mean values between 2011 and 2016. Panel A depicts on the left the heat map of EU countries in terms of SOD and CAGR—greener cells indicate lower standardized values, and darker red cells indicate higher standardized values—for influenza. Areas of the heat map coloured in green indicate lower vulnerability, and areas coloured in red indicate higher vulnerability to diseases, measured in SOD and/or CAGR. The right side of the panel shows the dendrogram of countries’ distribution in clusters based on the linkage distance (the distance between cluster members). Panel B presents the standardized (or normalized means, i.e., means on adjusted values to scale) of clustering variables (SOD and CAGR for influenza) for the two statistically significant clusters and the error bars based on standard errors. Cluster 1 includes 5 members, cluster 2 includes 3 members, cluster 3 includes 17 members, and cluster 4 has 2 members. Panel C presents the variables’ importance for predicting cluster membership via the C&RT/boosted tree algorithm, based on 100 repeatedly drawn samples via bootstrapping. The closer to 1 the variable is, the higher its importance for countries’ inclusion in one of the two clusters. Error bars in Panel C are based on standard deviations of variable importance. (2) There are four clusters based upon influenza SOD and CAGR. Cluster 1 includes 5 western countries, with the highest influenza SOD and second-highest CAGR of influenza SOD, for both population sets. Cluster 2 includes 3 eastern countries, with the lowest influenza SOD and CAGR for both population categories. Cluster 3 includes 17 countries, except for Slovenia and Ireland, with low influenza SOD but very high SOD growth rate, which belong to cluster 4. Of the four clustering variables, influenza SOD and CAGR for the population above 65 years have slightly higher predictive power for countries’ assignments into clusters.

