Figure 5.
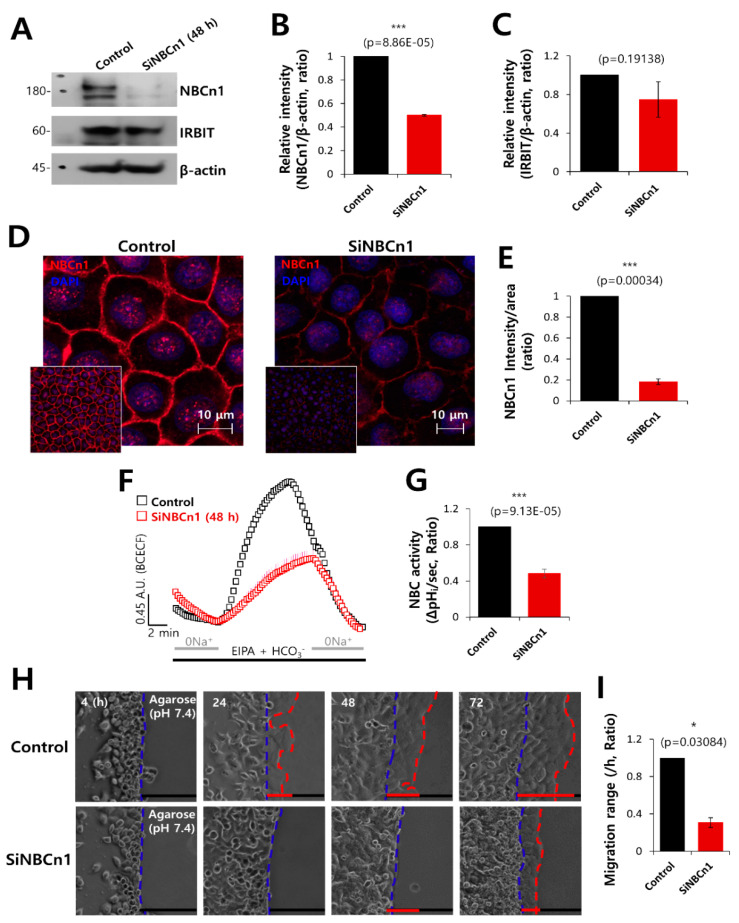
NBCn1 knockdown reduced cell motility. (A) Protein expression of IRBIT and NBCn1 in A549 cells in the presence of SiRNA-NBCn1 (SiNBCn1). IRBIT and β-actin were used as loading controls. (B, C) Analysis of the relative intensity of NBCn1 and IRBIT. The bars indicate the mean ± SEM of the intensities of NBCn1 and IRBIT normalized by β-Actin (n = 3). (D) Immunostaining images of NBCn1 (red) and nucleus (DAPI, blue), with or without SiNBCn1. The smaller panels represent the original magnified images. The scale bars in the magnified images represent 10 μm. (E) The bars indicate the mean ± SEM of the intensity of NBCn1 per area (n = 3). (F) NBC activity in A549 cells with (red open square) or without (control, black open square) SiNBCn1 at 48 h. Averaged traces are presented. (G) The bars indicate the mean ± SEM of NBC activity (n = 4). (H) Time-dependent representative images of migration of A549 cells toward the agarose spots containing PBS (pH 7.4) and in the presence or absence of SiNBCn1 for indicated times. (I) Analysis of migration range per hour. The bars indicate the mean ± SEM of data (n = 5).

