Figure 7.
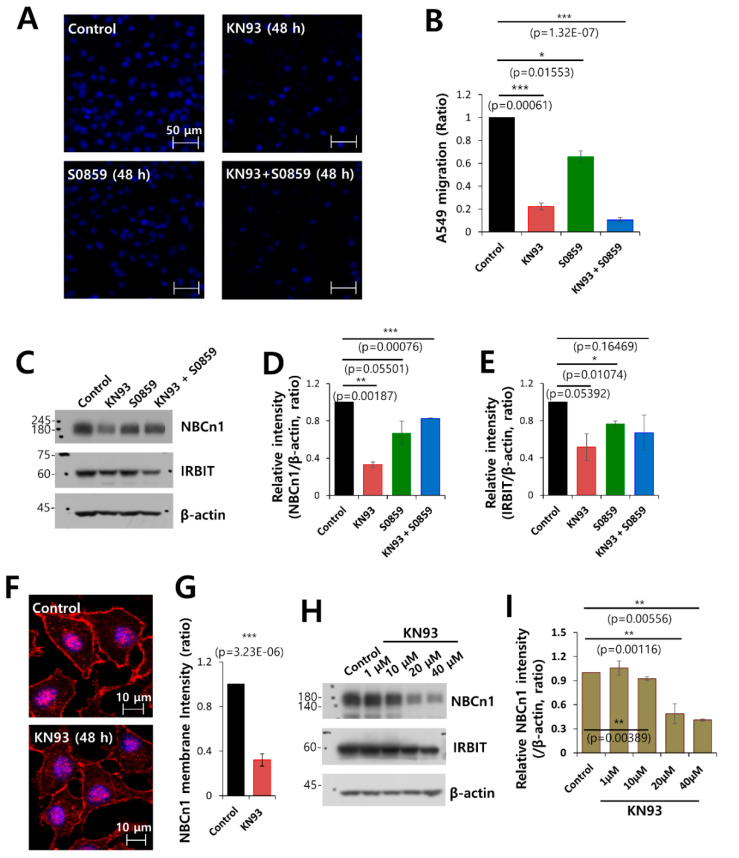
Combined inhibition of CaMKII and NBC markedly inhibited cell migration. (A) Migration of A549 cells was measured by a transwell membrane migration assay. The cells were incubated with the medium and reagents indicated hereafter (bottom chamber: media of pH 6.5; upper chamber: pretreatment with KN93 and S0859 at 48 h). Immunofluorescence staining with DAPI (blue). The scale bars represent 50 μm. (B) Analysis of the total intensity of DAPI for determination of A549 migration. The bars represent the mean ± SEM of data (n = 4). (C) Protein expression of IRBIT and NBCn1 in A549 cells in the presence of KN93 and S0859 at 20 μM. β-Actin was used as a loading control. (D) Analysis of the relative intensity of NBCn1. The bars indicate the mean ± SEM of the intensities of NBCn1 normalized by β-Actin (n = 3). (E) Analysis of the relative intensity of IRBIT. The bars indicate the mean ± SEM of the intensities of IRBIT normalized by β-Actin (n = 3). (F) Immunostaining images of NBCn1 (red) and nucleus (DAPI, blue) in the presence or absence of 20 μM KN93. Scale bars of the magnified images represent 10 μm. (G) The bars indicate the mean ± SEM of the NBCn1 membrane determined from three experimental replicates (n = 3). (H) Protein expression of IRBIT and NBCn1 in A549 cells in the presence of KN93 at 1–40 μM. β-Actin was used as a loading control. (I) Analysis of the relative intensity of NBCn1. The bars indicate the mean ± SEM of the intensities of NBCn1 normalized by β-Actin (n = 3).

