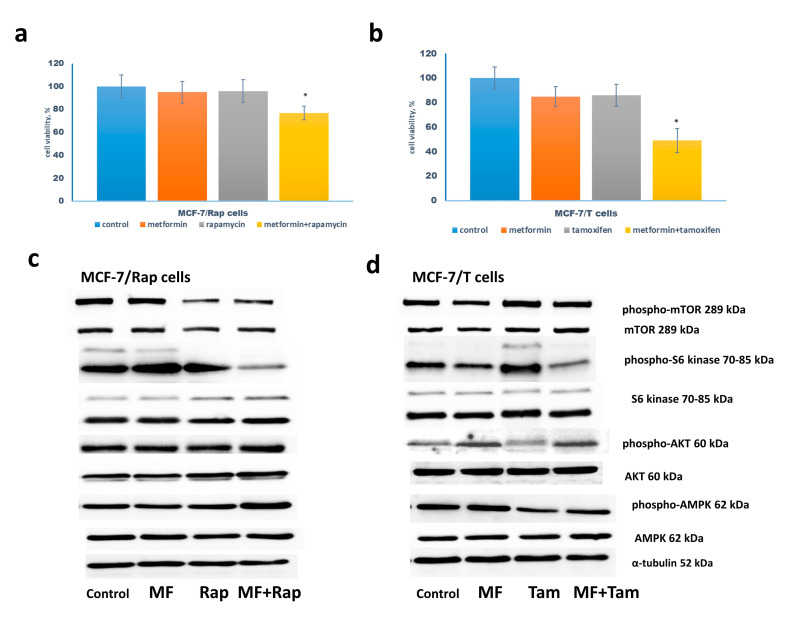
Figure 3.
Drug sensitivity of MCF-7/Rap and MCF-7/T cells. (a,b) Cell growth. The MCF-7/Rap cells were treated without or with 1 µM rapamycin in the presence or absence 2 mM metformin (MF) (a), the MCF-7/T cells—with 5 µM tamoxifen (Tam) and/or 2 mM metformin (b) for 3 days in standard DMEM medium with 10% FBS, and the amount of the viable cells was counted by the MTT test; Data represent mean value ± SD of three independent experiments. One-hundred percent was set as the viability of cells treated with vehicle control. p < 0.05: * versus control and either drug alone. (c,d) Western blot analysis. The MCF-7/Rap and MCF-7/T cells were treated as indicated above. Western blot analysis of AMPK, phospho-AMPK, mTOR, phospho-mTOR, S6 kinase, phospho-S6 kinase, Akt, phospho-Akt was performed in the cell extracts. Protein loading was controlled by membrane hybridization with α-tubulin antibodies.

