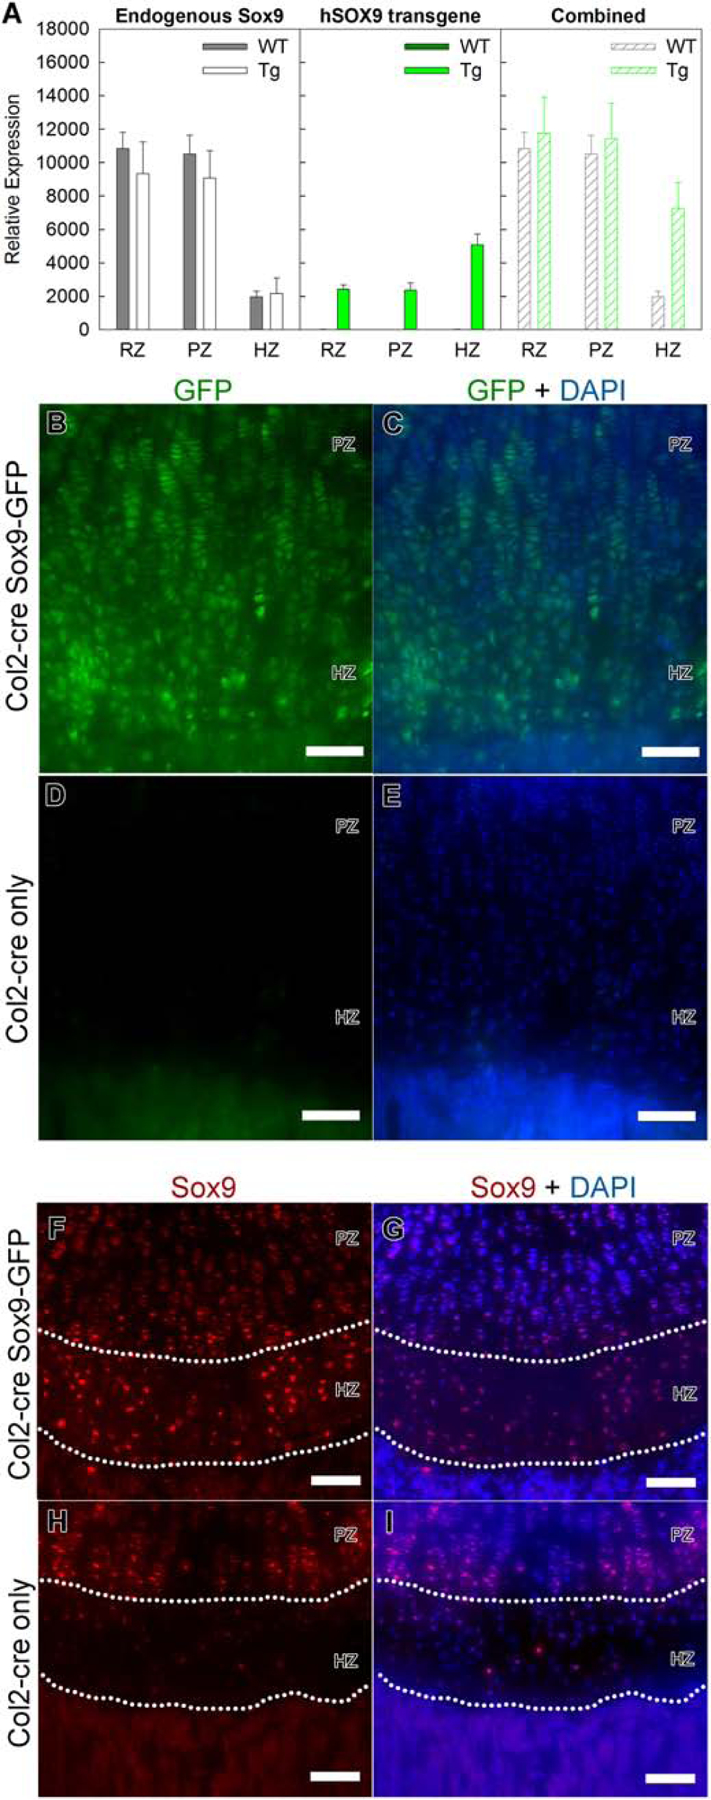
Figure 1. A transgenic mouse model expressing human SOX9.

A detailed study of the phenotype of this mouse line has been described in a prior publication [18] (A) qPCR was used to quantitatively assess expression of endogenous Sox9, transgenic hSOX9, or their combined expression in resting (RZ), proliferative (PZ) and hypertrophic zone (HZ) of growth plates from Col2-cre Sox9-GFP mice (TG) and Col2-cre littermates (WT). (Number of animals, N=6) (B–E) Fluorescent microscopy images showing the presence of GFP signal in 1 wk tibial growth plate in the Col2-cre Sox9-GFP transgenic mouse (B,C), but not in wild-type littermates (D,E, Col2-cre only). DAPI was used for counterstaining (C,E). (F–I) Fluorescence immunohistochemistry confirmed that Sox9 expression was present throughout the growth plate, including the hypertrophic zone (the area between the dotted curves), in Col2-cre Sox9-GFP transgenic mouse (F,G). In contrast, Sox9 expression decreased notably in the hypertrophic zone of the growth plate in wild-type littermates (H,I, Col2-cre only). DAPI was used for counterstaining (G,I) PZ, proliferative zone; HZ, hypertrophic zone; scale bar, 100 μm.
