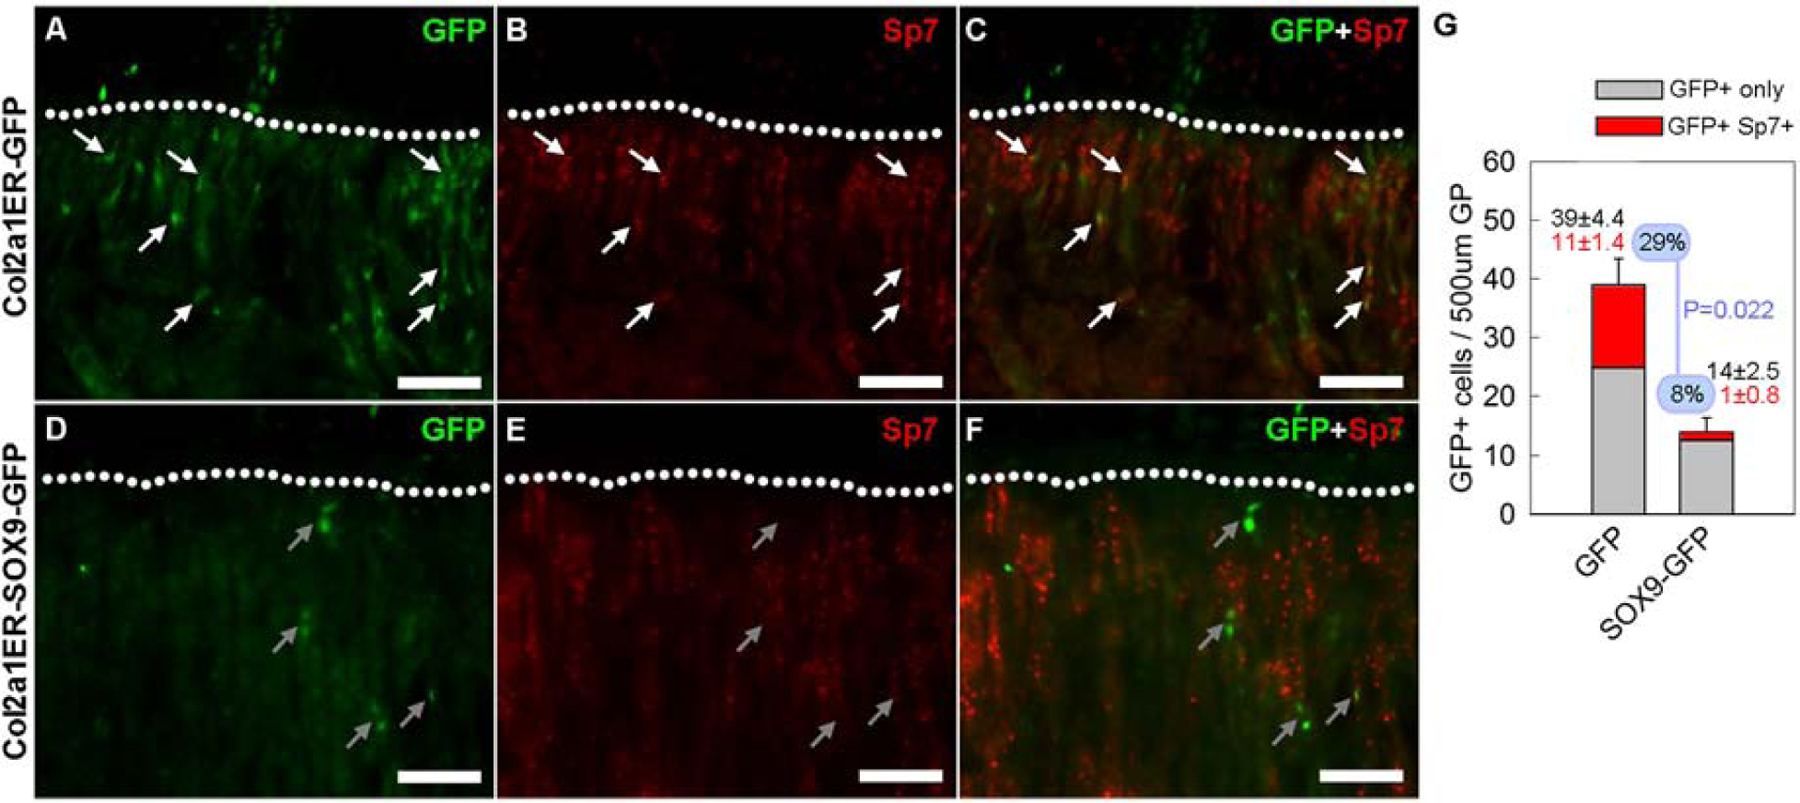
Figure 4. Transgenic Sox9 expression suppressed transdifferentiation of chondrocytes into osteoblasts.

Lineage tracing experiments were performed as described in Figure 3A. At 4 weeks of age, bones were sectioned, and fluorescent microscopy was used to detect GFP and Sp7 expression. (A–C) In Col2a1ER-GFP mice, many of the GFP-positive cells that moved into the trabecular bone (area below the dotted curve) also expressed Sp7 (red, yellow when overlapping with green signal of GFP), as indicated by the white arrows. (D–F) In contrast, in Col2a1ER-SOX9-GFP mice, GFP-positive cells in the trabecular bone rarely stained positive for Sp7, as indicated by the gray arrows. (G) The number of GFP-positive, Sp7-negative (GFP+ only)and the number of GFP-positive and Sp7-positive (GFP+ Sp7+) cells in the metaphysis were counted. In mice with Sox9 misexpression, there were fewer total GFP-positive cells, fewer GFP-positive, Sp7-positive cells. The fraction of GFP-positive cells that were also Sp7-positive was also decreased (8% versus 29%, Col2a1ER-SOX9-GFP versus Col2a1ER-GFP mice, P=0.022, N=4).
