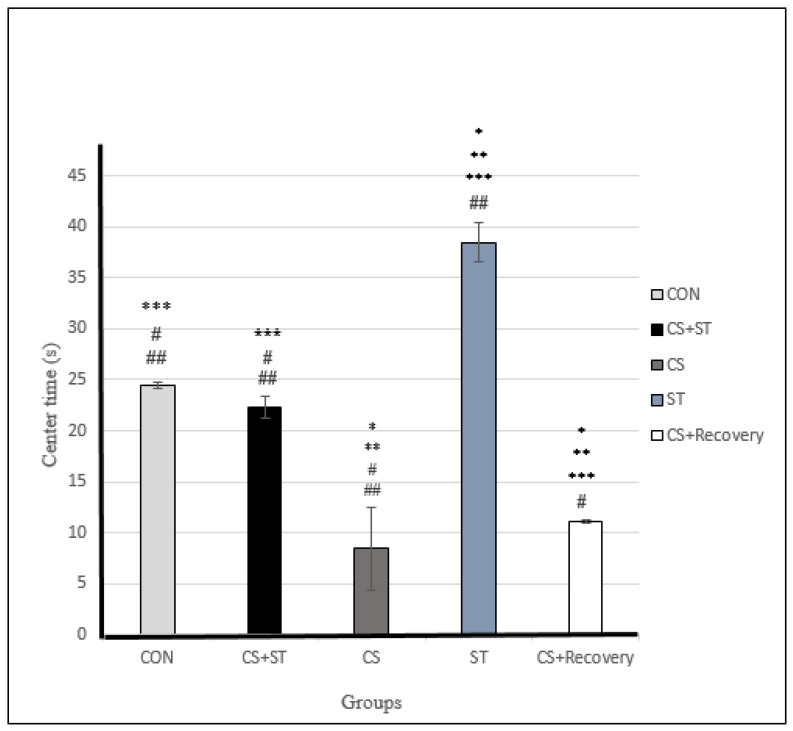
Figure 6.
Center time (s) in male rats. Data are expressed as the mean ± S.E.M. * p < 0.001, significantly different from the control group. ** p < 0.001, significantly different from the CS + ST group. *** p < 0.001, significantly different from the CS group. # p < 0.001, significantly different from the ST group. ## p < 0.001, significantly different from the CS + Recovery group. CS + ST: chronic mild stress followed by swimming training, CS: chronic mild stress, ST: swimming training, CS + Recovery: chronic mild stress followed by recovery time, CON: control.

