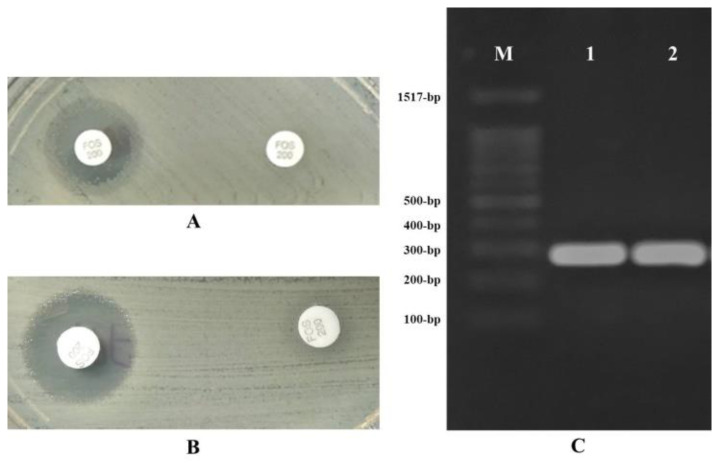
Figure 2.
Detection of fosfomycin resistance-mediating glutathione S-transferase (sodium phosphonoformate test) and fosA3 gene (electrophoresis) in strains 66 and 871. (A,B) Phenotypic detection of fosfomycin resistance-mediating glutathione S-transferase in strains 66 and 871, respectively, showing an increase of ≥5 mm in growth inhibition halo around the disk of 200 μg fosfomycin supplemented with 50 μg G6P plus sodium phosphonoformate in comparison to the disk containing 200 μg fosfomycin supplemented with 50 μg G6P alone. All assays were performed in duplicate in all isolates, obtaining the same between-assay results; (C) Electrophoresis results for the PCR products of fosA3 gene (282 bp) on 0.8% agarose gel in strains 66 (line 1) and 871 (line 2). M: molecular weight.

