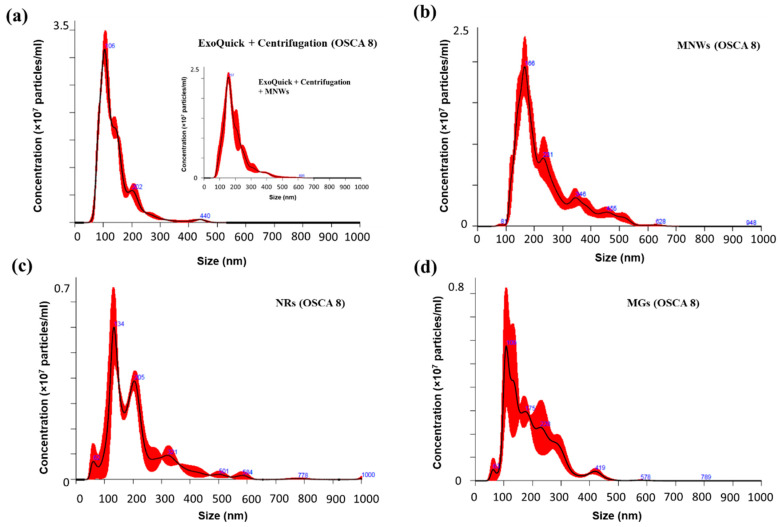
Figure 7.
Size distribution (black lines) of (a) TEX isolated non-magnetically (using ExoQuick-TC and centrifugation) and magnetically using (b) MNWs, (c) NRs, and (d) MGs. In the inset, the size distribution of TEX isolated non-magnetically after feeding MNWs to the cancer cells is depicted (no magnet was employed). Error bars (in red) indicate ±1 standard error of the mean.

