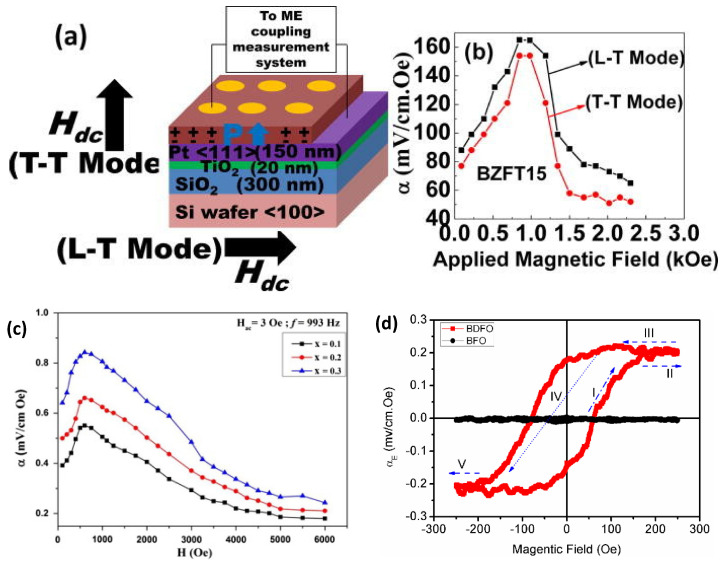
Figure 6.
(a) The schematic representation of the experimental conditions; and (b) M–E coupling coefficient versus applied magnetic field measured in both in-plane magnetized-out of plane polarized configuration (L–T) and out of plane magnetized-out of plane polarized (T–T) modes. Reproduced with permission from [25]. (c) ME coefficient for a HAC = 3 Oe at 993 Hz [26]. (d) MEP (H) hysteresis loops displayed at 300 K, showing the variations of the ME coefficient as a function of the applied magnetic field for of BDFO (red) and BFO (black). Reproduced with permission from [28].

