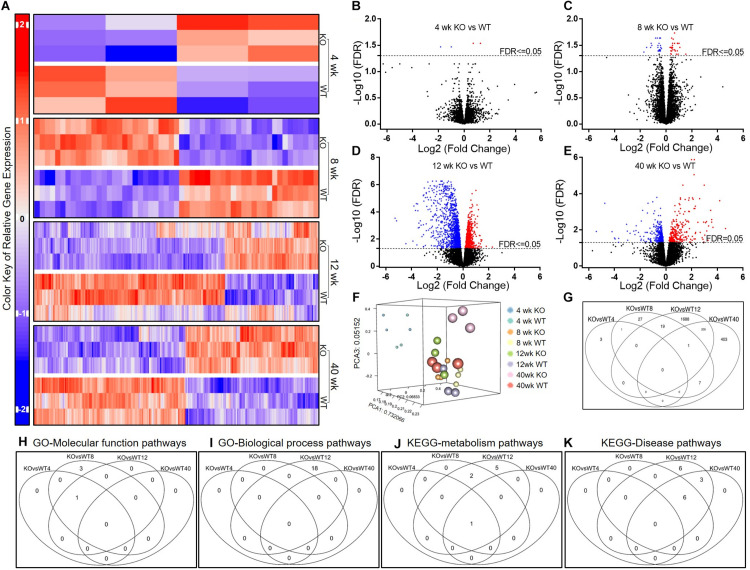
FIGURE 4.
Comparison of the AM gene expression patterns in Scgb1a1 KO and WT mice. (A) Up-regulated and down-regulated genes in AMs at 4, 8, 12, and 40 weeks; (B–E). Volcano plots of significantly up-regulated (red) and down-regulated (blue) genes (FDR < 0.05); (F) PCA plot of the variant feature of gene expression; (G) Venn diagrams of the significantly changed genes. Venn diagrams of the significantly changed gene sets in AMs from KO vs WT mice at different ages including GO-Molecular function pathways (H), GO-Biological process pathways (I), KEGG-metabolism pathways (J), and KEGG-Disease pathways (K). FDR < 0.05 was considered significant; FC, fold change.

