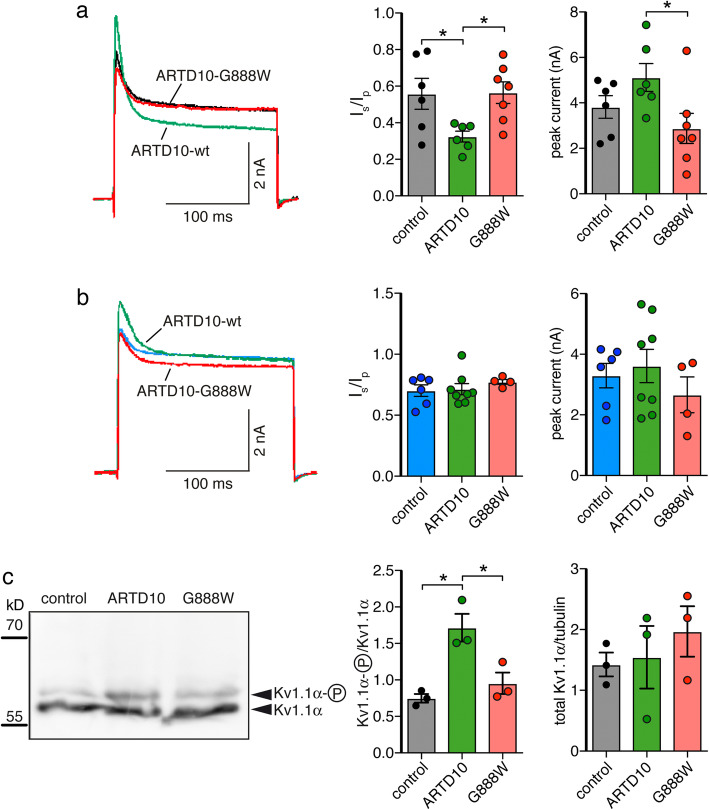
Fig. 4.
ARTD10 leads to phosphorylation of Kv1.1 at S446. a, b Left, Representative current traces of wild type (a) or the phosphorylation-deficient mutant (b) of Kv1.1 overexpressed in three different HeLa cell lines. Right, bar graphs representing Isteady-state/Ipeak (Is/Ip) and peak current amplitudes. *p < 0.05 (one-way ANOVA followed by Tukey’s test). c Left, total Kv1.1α protein from control HeLa cells or from stably transfected HeLa cells expressing wild type or catalytically inactive ARTD10. Right, ratio of phosphorylated and unphosphorylated Kv1.1α and of total Kv1.1α and tubulin (n = 3)

