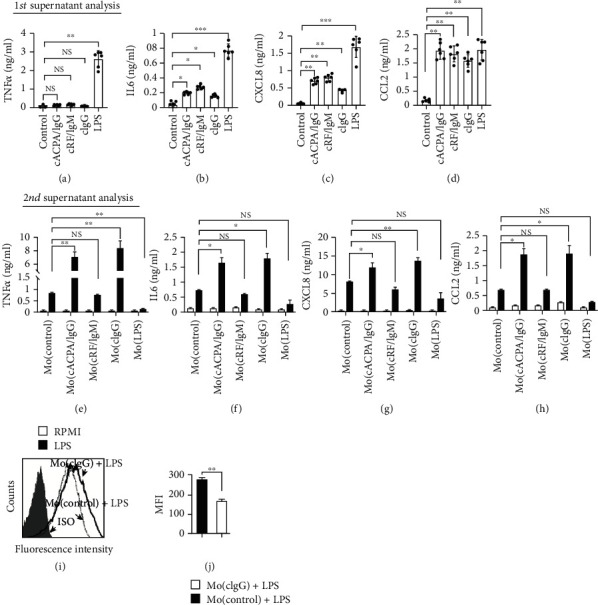
Figure 2.

Enhanced LPS response by ACPA IgG-primed monocytes. (a–d) ELISA quantification of TNFα, IL6, CXCL8, and CCL2 in the supernatant during monocyte priming. After priming, the Mo(cACPA/IgG), Mo(cRF/IgM), Mo(cIgG), Mo(control), and Mo(LPS) were treated with LPS (10 ng/ml); monocytes treated in RPMI 1640 medium were used as the control (RPMI). (e–h) ELISA quantification of TNFα, IL6, CXCL8, and CCL2. Each dot represents one donor (n = 6). (i) The Mo(cIgG) and Mo(control) were stimulated with LPS (10 ng/ml) for 2 h, followed by intracellular staining of TNFα. (j) Cells stained with isotype control Abs (filled histogram) were used as negative controls. The MFI of TNFα was compared. Data (mean ± SEM) are from three independent experiments. NS: no statistical significance; ∗P < 0.05, ∗∗P < 0.01, and ∗∗∗P < 0.001. The Kruskal–Wallis test was performed, followed by post hoc testing by Dunn's multiple comparison test, for comparing >2 groups. The Mann–Whitney U test was used for comparing two groups.
