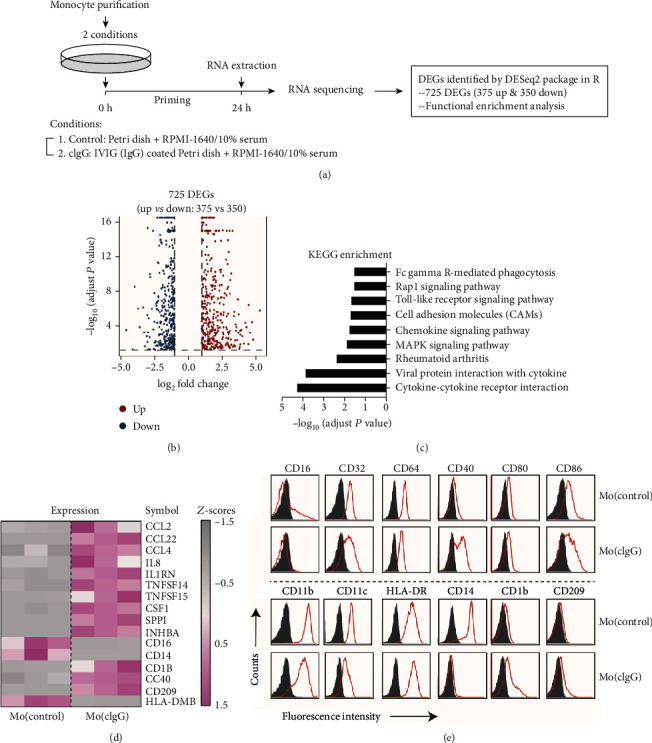
Figure 3.

Specific gene signatures of cIgG-trained human monocytes. (a) Schematic workflow of RNA sequencing and analysis of the cIgG-trained monocytes. (b) Volcano plot of 725 DEGs from Mo(cIgG) as compared with Mo(control). (c) Bar plot of KEGG enrichment analysis of DEGs in Mo(cIgG). (d) Heatmap showing the signature cytokine, chemokine, and cellular marker genes expressed in Mo(cIgG) and Mo(control). (e) Flow cytometric analysis of Mo(cIgG) stained with isotype control Abs (filled histogram) and specific markers as indicated (red).
