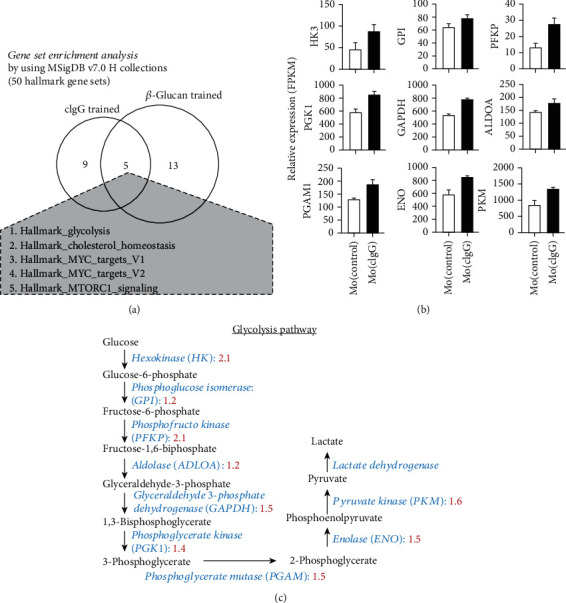
Figure 4.

Comparative transcriptomic analysis between cIgG- and β-glucan-trained monocytes. (a) Venn diagram of GSEA of trained monocytes using hallmark gene sets collected in MSigDB v7.0. The five shared hallmark gene sets were glycolysis, cholesterol homeostasis, MYC-targets_V1, MYC-targets_V2, and MTORC1_signaling. (b) Relative gene expression of glycolytic enzymes (HK3, fold change (fc) = 2.1, P = 0.00453; GPI, fc = 1.2, P = 1.75E − 11; PFKP, fc = 2.1, P = 3.07E − 09; PGK1, fc = 1.2, P = 2.39E − 09; GAPDH, fc = 1.5, P = 0; ALDOA, fc = 1.4, P = 2.16E − 11; PGAM1, fc = 1.5, P = 7.34E − 09; ENO, fc = 1.5, P = 0.00442; and PKM, fc = 1.6, P = 2.86E − 10) was defined by FPKM (fragments per kilobase of exon model per million reads mapped) values from RNA sequencing (GSE102728) as compared between the Mo(cIgG) and Mo(control). Data (mean ± SEM) are from three independent experiments. P values indicate the posterior probability of differential expression (PPDE). (c) Glycolysis pathway from glucose to lactate. Fold changes in glycolytic enzymes were compared between cIgG-trained and control cells, as labeled in red.
