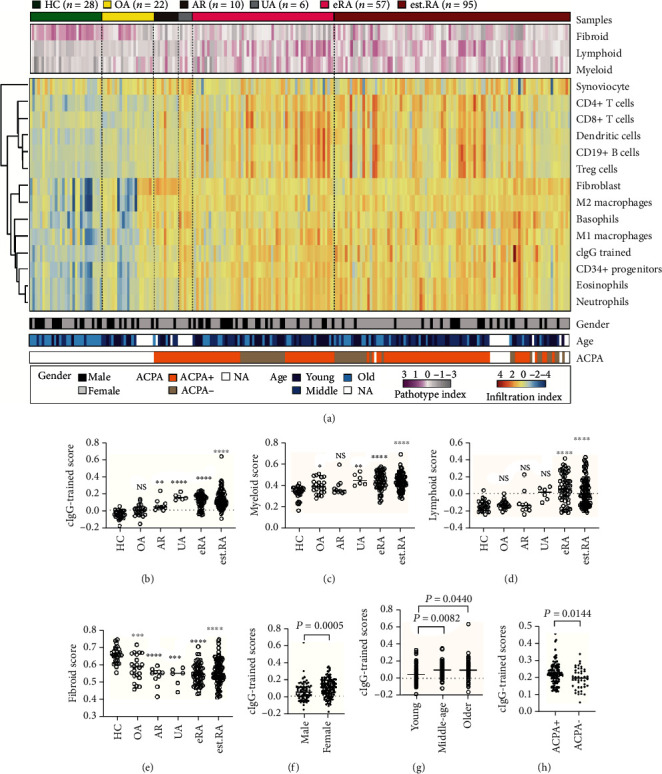
Figure 5.

cIgG-trained signatures enriched in synovial biopsies. (a) Heatmap showing hierarchical clustering according to disease status, pathotype, cell-specific gene score, and clinical information. The synovial samples were from healthy donors (HC, n = 28) and from patients with osteoarthritis (OA, n = 22), arthralgia (AR, n = 10), undifferentiated arthritis (UA, n = 6), early RA (eRA, n = 57), and established RA (est.RA, n = 95). (b–e) Enriched scores of cIgG-trained monocytes and three pathotypes among the groups. Comparison of cIgG-trained scores in groups according to (f) sex, (g) age, and (h) ACPA status is shown. Each dot represents one donor. NS: no statistical significance; ∗P < 0.05, ∗∗P < 0.01, and ∗∗∗P < 0.001. The Kruskal–Wallis test, followed by post hoc testing by Dunn's multiple comparison test, was used for comparing >2 groups. The Mann–Whitney U test was used for comparing two groups.
