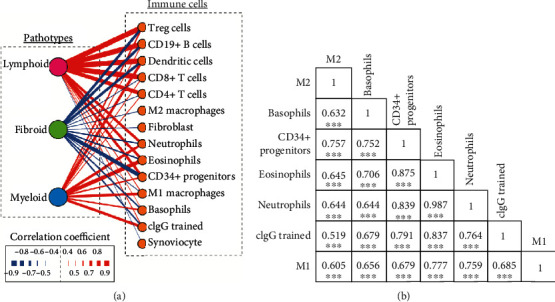
Figure 6.

Correlation of RA synovial pathotypes with immune cells. (a) The relationship between the three RA synovial pathotypes, i.e., lymphoid, fibroid, and myeloid, and immune cells, represented by nodes. The interaction profile is shown in the links (lines) between the nodes, and the strength is highlighted by the thickness of the lines and the color. Red and blue lines indicate positive and negative correlations, respectively. (b) Correlation matrix for M1, M2, cIgG-trained monocytes, neutrophils, eosinophils, basophils, and CD34+ progenitors. Pearson correlation coefficients are indicated. ∗∗∗P < 0.001.
