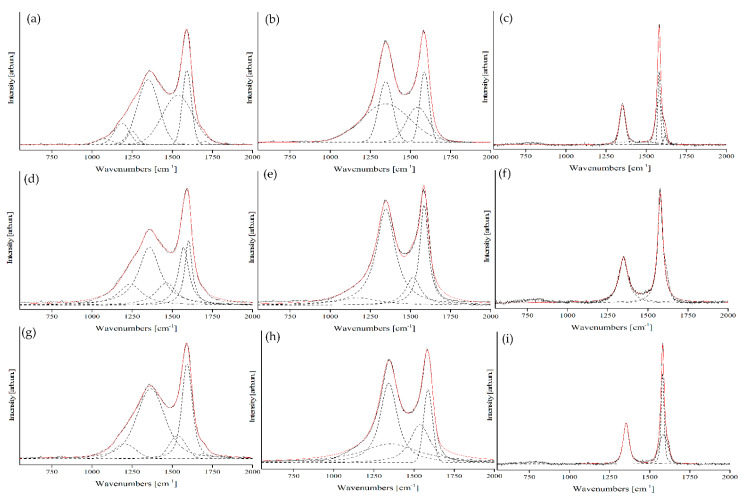
Figure 9.
Raman spectra and related fit using IGau (a–c), ILor (d–f) and Voigt functions (g–i) of OSR 550, OSR 1300 and OSR 2200 respectively. Original Raman spectra are reported by using solid black lines, the fitted Raman spectra are reported by using solid red lines and each component is reported in dashed black lines.

