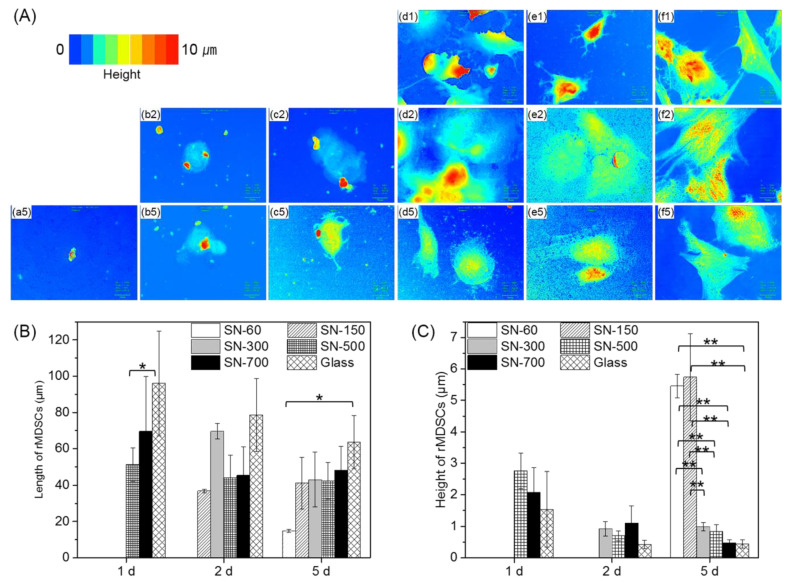
Figure 4.
Confocal microscopic analysis of the length and height of rMDSCs grown on different SN and glass at 1, 2, and 5 days. (A) Confocal microscopic images; color corresponds to cell height from low (blue) to high (red). (a) SN-60, (b) SN-150, (c) SN-300, (d) SN-500, (e) SN-700, and (f) glass. The numbers indicate 1, 2, and 5 days. Magnification, ×1000; scale bar = 15 μm. Quantification of the results of (B) length and (C) height of rMDSCs shown in (A). Data of length and height of rMDSCs were analyzed by one-way ANOVA with Bonferroni’s multiple comparison (* p < 0.01, ** p < 0.001).

