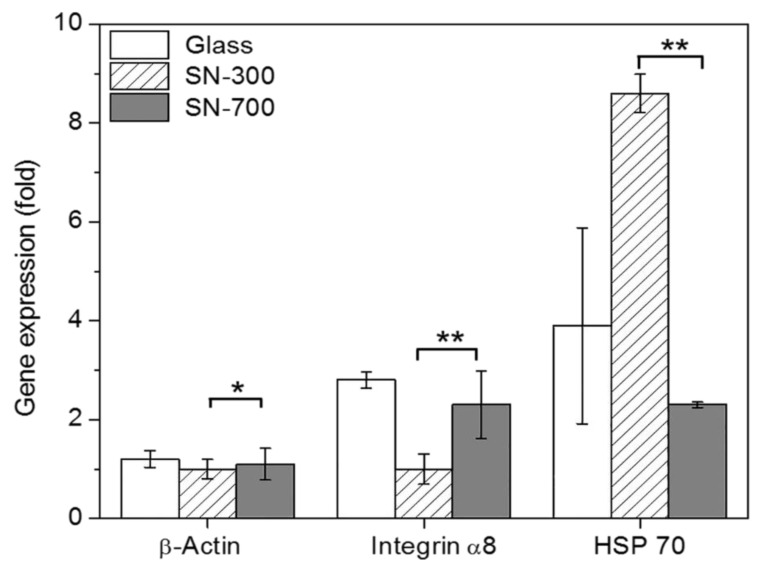
Figure 7.
Analysis of β-actin, integrin α8, and HSP 70 mRNA expression by quantitative RT-PCR. The expression values of β-actin, integrin α8, and HSP 70 mRNA in rMDSCs grown on glass, SN-300, or SN-700 at 5 d were normalized to those of GAPDH expression of rMDSCs on glass, SN-300, or SN-700. Gene expression data were analyzed by one-way ANOVA with Bonferroni’s multiple comparison (* p < 0.05, ** p < 0.01).

