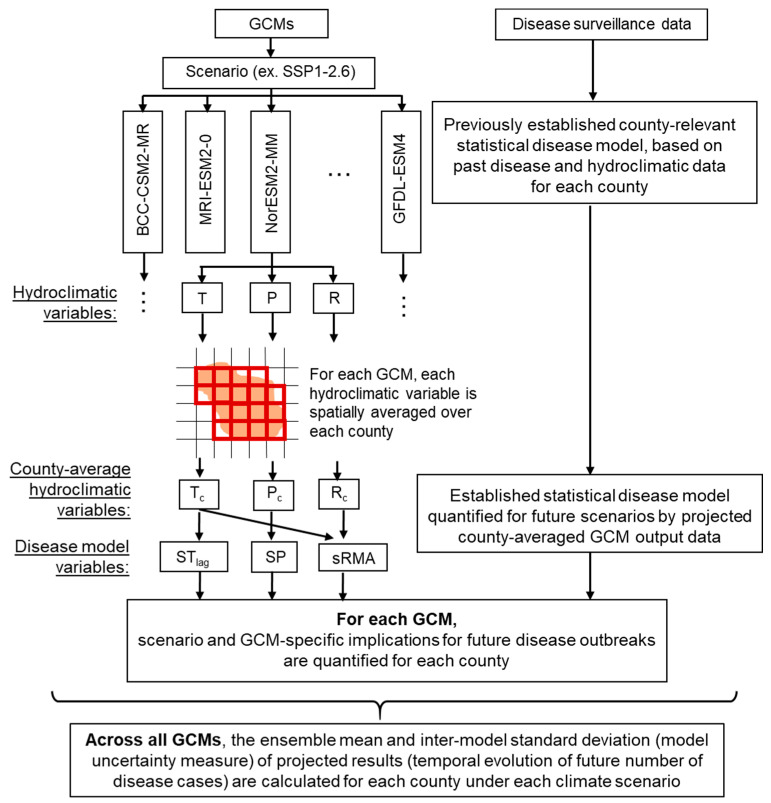
Figure 2.
Schematic diagram of the model and statistical analysis approach in this study. For each county, we selected daily outputs of disease-relevant hydroclimatic variables (related to air temperature T, precipitation P, and runoff R) for the grid cells of each global climate model (GCM) with at least 40% of their area located within each targeted county (35% for Örebro county in The Geophysical Fluid Dynamics Laboratory’s Earth System Model version 4 (GFDL-ESM4) and The Geophysical Fluid Dynamics Laboratory’s climate model version 4 (GFDL-CM4)). We spatially averaged the values of each hydroclimatic output variable of each GCM over these county grid cells to represent a corresponding county-average daily hydroclimatic variable value (air temperature Tc, precipitation Pc, and runoff Rc). Furthermore, for each GCM, we assessed its hydroclimatic projection implications for the future scenario evolution of disease cases in each county, based on a previously established county-relevant statistical disease model that we quantified by preceding-year number of disease cases and relevant GCM-projected county-average hydroclimatic variables (including summer temperature in the preceding year STlag, summer precipitation in the same year SP, and standardized relative annual mosquito abundance sRMA, which is in turn related to various river flow Q conditions). Finally, across all GCMs, we calculated the model ensemble mean and inter-model standard deviation (as a GCM uncertainty measure) of scenario-implied possible future evolution of disease cases in each county. SSP1-2.6: Shared Socioeconomic Pathways (SSP) with emissions driven by sustainable practices to produce radiative forcing of 2.6 Wm−2 by 2100; BCC-CSM2-MR: The Beijing Climate Center Climate System Model, Version 2-MR; MRI-ESM2-0: The Meteorological Research Institute Earth System Model, Version 2.0; NorESM2-MM: The Norwegian Earth System Model, Version 2-MM.

