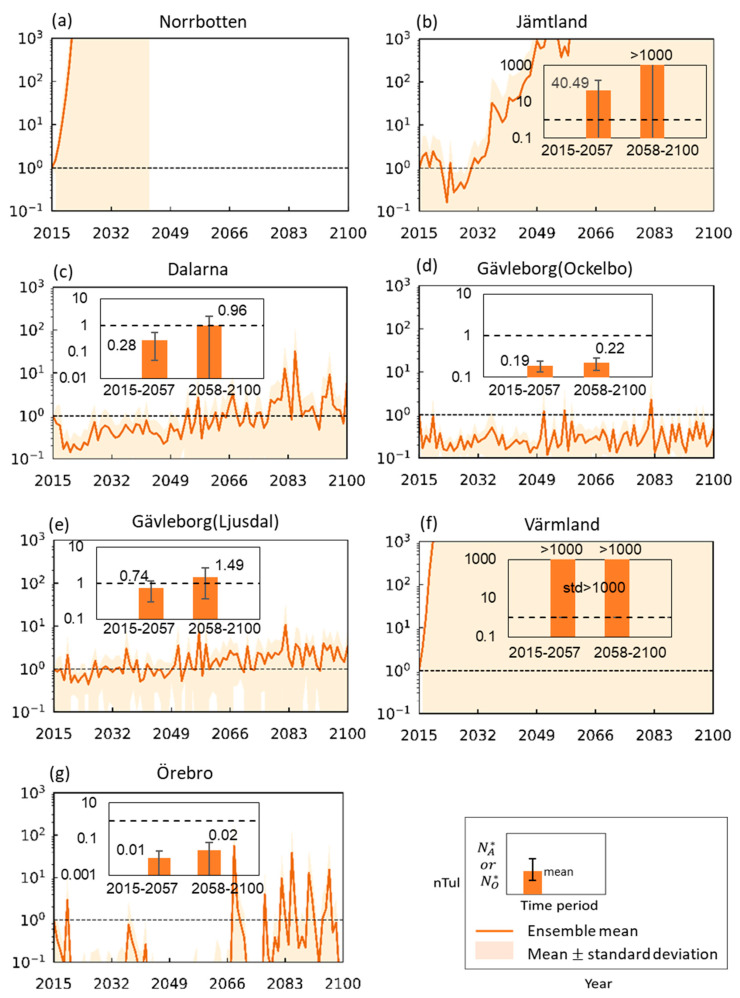
Figure 5.
Normalized projected ensemble mean number of annual tularemia cases (nTul) for 2015–2100, and (inserts) associated normalized endemic levels ( or ) for the periods 2015–2057 and 2058–2100. Results are shown for the Swedish counties Norbotten (a), Jämtland (b), Dalarna (c), Gävleborg (two sites) ((d) and (e)), Värmland (f), and Örebro (g) under CMIP6 climate scenario SSP2-4.5. The shaded areas (main figures) and error bars (inserts) show ± 1 inter-model standard deviation around the model ensemble mean.

