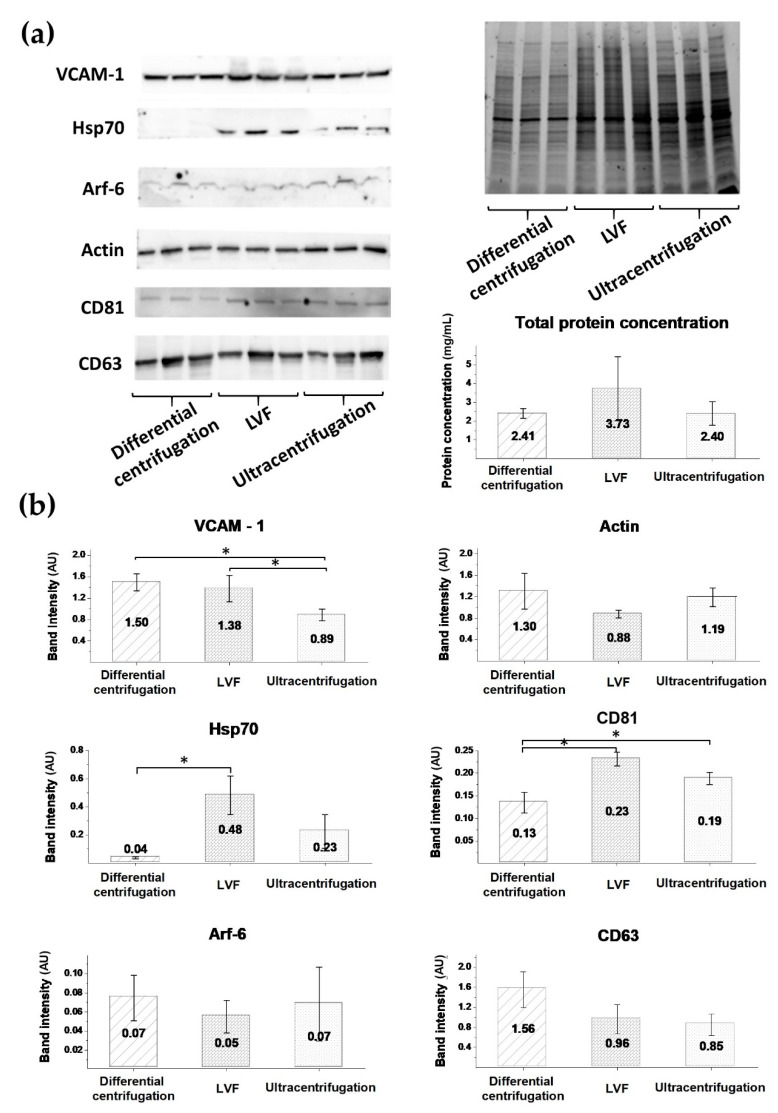
Figure 7.
Results of the Western blot analysis. (a) Images of the membrane after blotting and the gel after electrophoresis with clearly visible differences in bands’ intensities between the EV samples isolated by different methods; (b) Band intensity analysis. Data are presented as mean values (column) and SDs (whiskers). The analysis was performed using the Kruskal–Wallis test. Differences between subgroups were tested with Dunn’s posthoc test, and statistically significant differences are marked with an asterisk (p < 0.05).

