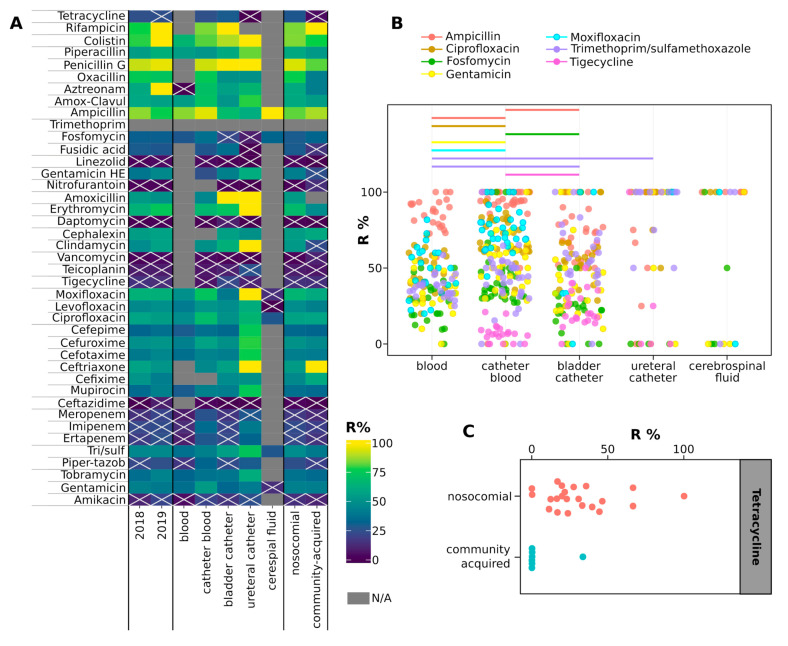
Figure 6.
(A) Heatmap showing the percentages of resistant strains grouped according to the classification indicated in columns. The color of each cell shows the percentage of strains resistant to the antibiotic listed in rows, with N/A indicating that strains of the corresponding group were not tested with the antibiotic indicated in the row. Crossed cells indicate groups of isolates not significantly more resistant to the antibiotic indicated in the row compared to the rest of the antibiotics (two-sided, unpaired Welch t-test fdr > 0.05, comparing the % of strains of the group resistant to the antibiotics to the % of resistances of the group of strains). (B) box plots showing the percentages of strains resistant to the listed antibiotics according to the isolation source. Only drugs for which significant differences in resistance percentages have been observed between isolation sources are shown. Horizontal lines indicate significant differences among resistance percentages to the antibiotic indicated with the color (Wilcoxon test fdr < 0.05). (C) box plot showing the percentages of strains resistant to the listed antibiotics according to the infection type. In panels B and C, each point represents a group of isolates (strains isolated from the same specimen, in the same year and month, and associated with the same type of infection).

