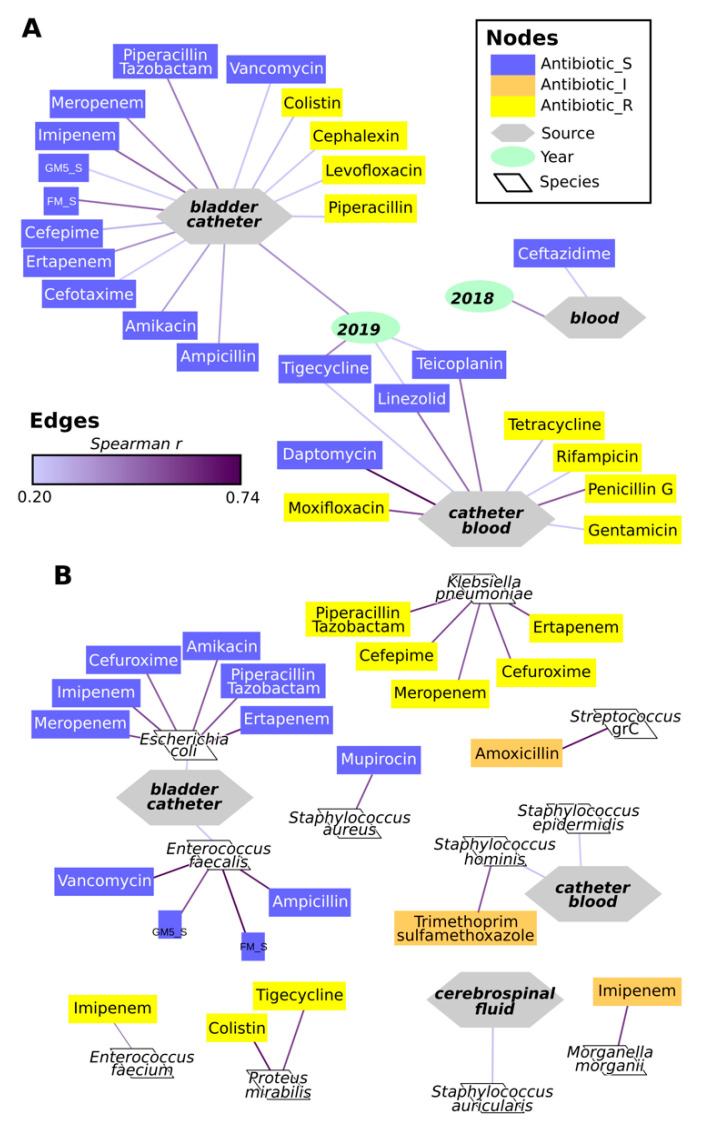
Figure 7.
Spearman correlations among year, source of isolation, microbial species, and susceptibility to antibiotics. (A) correlations among year and source of isolation and susceptibility to antibiotics. (B) correlations among microbial species and sources and year of isolation and susceptibility to antibiotics. Edges indicate the presence of a significant correlation (Spearman correlation r > 0.2 and fdr < 0.05), with the color of the line indicating the correlation r, as indicated in the legend. To simplify the representation, only correlations with r > 0.5 are shown for relations between microbial species and other variables.

