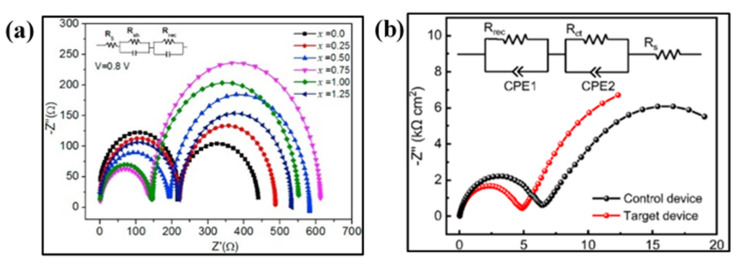
Figure 9.
(a) Nyquist plots with different DEA molar ratios (x), measured at a bias of 0.8 V in the dark. Reproduced with permission from [71]. Elsevier, 2018. (b) Nyquist plots of HTM-free monolithic PSC with SnO2 as ETL (Control device) and bi-layered ZTO as ETL (Target device). Reproduced with permission from [66]. American Chemical Society, 2019.

