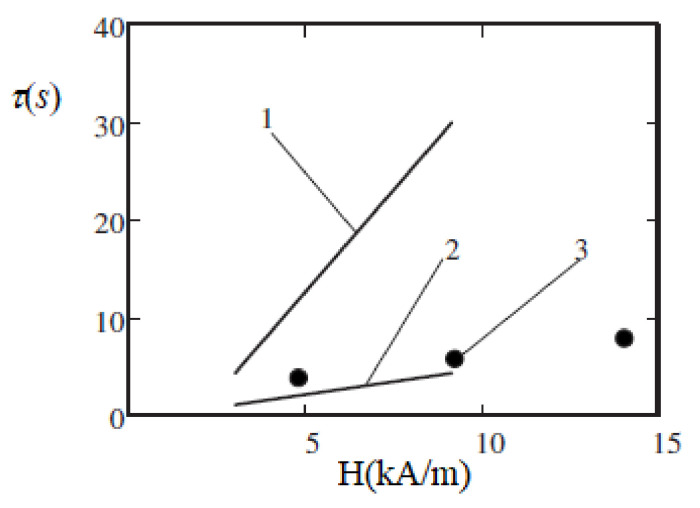
Figure 10.
Relaxation time versus the applied magnetic field H. Curves 1 and 2—theoretical calculations [92] for a ferrofluid with the same parameters as in Figure 9. Theory: the shear rate changed in a stepwise manner from 16 s−1 to 1.6 s−1 (line 1) and back (line 2). Dots 3—experiments [70] with an oscillating shear flow. Published with the permission of the American Physical Society (license RNP/20/AUG/029408).

