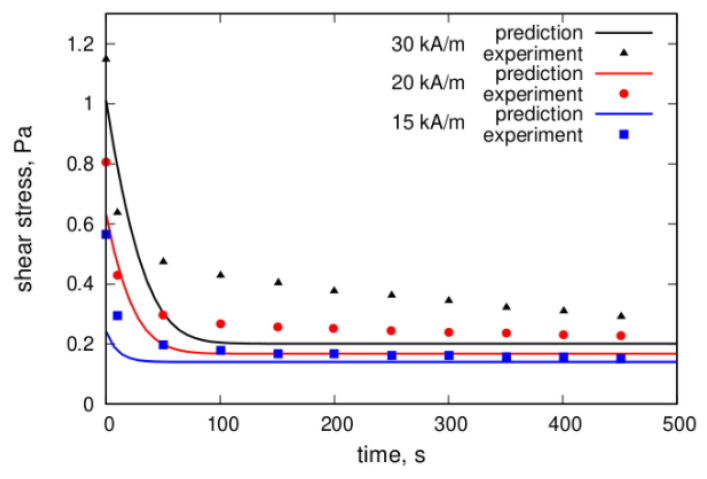
Figure 19.
Comparison of the theoretical prediction and experimental results of the stress relaxation for various magnetic field strengths after a stepwise change of the shear rate from 0.02 to 0 s−1. Details of the experiment and calculations are given in [144]. The plots were redrawn by the authors using our own raw data.

