Figure 2.
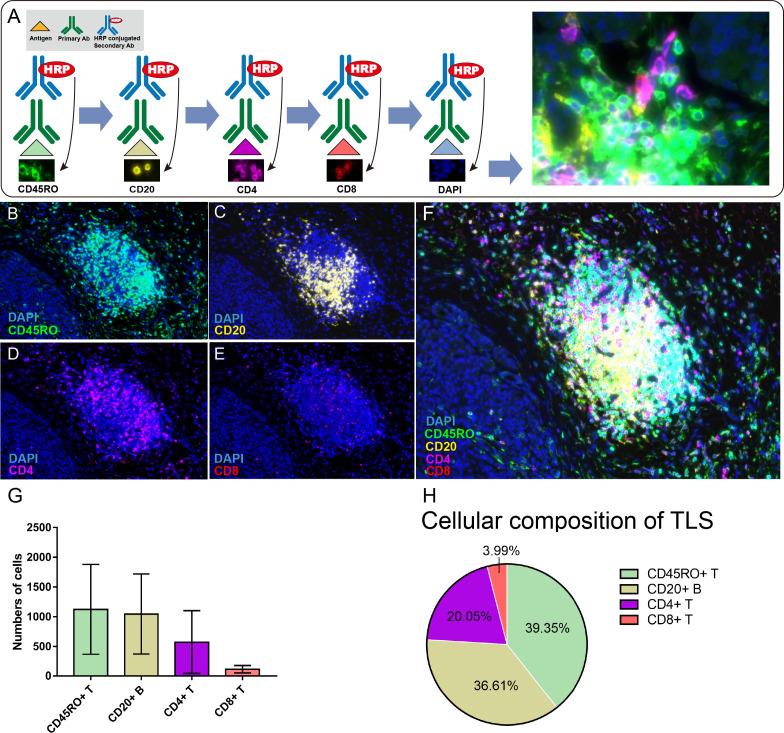
Multispectral fluorescent immunohistochemistry on G1/G2 non-functional pancreatic neuroendocrine tumors (NF-PanNETs). (A) A schematic of the sequential antibody staining approach used for multispectral immunohistochemistry indicating the color used for each protein of interest: CD45RO, green; CD20, yellow; CD4, violet; CD8, red. Cell nuclei were stained with DAPI (blue). (B–E) G1/G2 NF-PanNET tissues showing the localization of each of CD45RO, CD20, CD4, CD8. Magnification: 100×. (F) Merged image showing the colocalizations of DAPI, CD45RO, CD20, CD4 and CD8. Magnification: 100×. (G) Quantification of the numbers of cells positive for each of CD45RO, CD20, CD4, and CD8. The histogram displays the average number of each kind of cell counted in the five TLS shown in figure 2F and online supplemental figure S1. Error bars represent SD of the mean. (H) Pie chart displaying the percentages of each kind of cell counted in (G) to describe the immune cell composition of the TLS. G1/G2, grade 1/grade 2; HRP, horseradish peroxidase; TLS, tertiary lymphoid structures.

