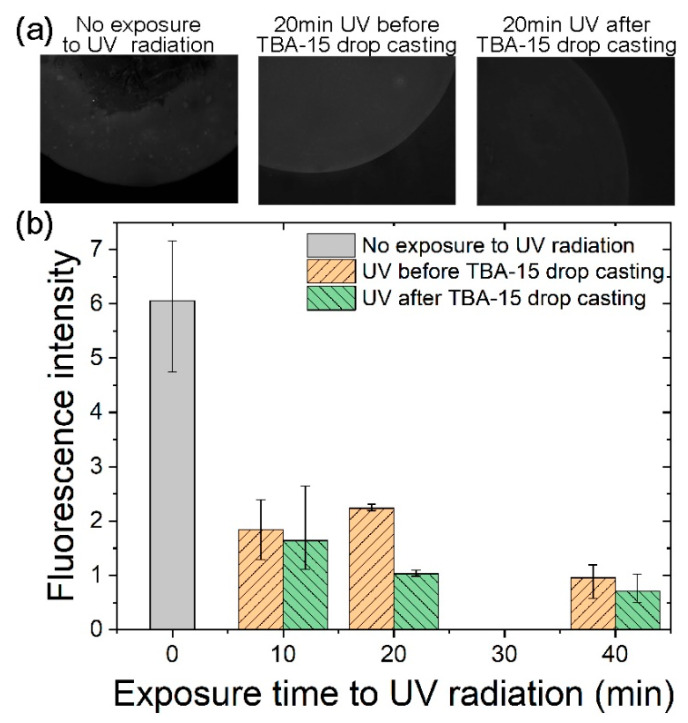
Figure 3.
Analysis of fluorescence intensity for TBA–15 grafting and hybridization by means of GOPS-based functionalization with and without exposure to UV light. (a) Typical epifluorescence microscopy images of GOPS silanized Si/SiO2 (100 nm) substrates in different cases regarding UV treatment (no UV exposure, 20 min UV exposure before and after TBA-15 drop casting) and after DNA grafting and hybridization. (b) Fluorescence intensity, as measured on fluorescence micrographs, as a function of exposure time to UV radiation. For all conditions, three fluorescent spots on the substrate were analyzed giving an average fluorescence intensity value and error bars corresponding to the minimum and maximum fluorescence intensity found for each sample.

